Your Ultimate Jenkins Dashboard Guide

Out of the box, the Jenkins dashboard is functional, but let's be honest—it's a bit generic. It gives you a one-size-fits-all list of jobs that barely scratches the surface of what Jenkins can do. Think of it as a starting point. This guide is all about moving beyond that basic interface to build a command center that actually works for your team.
Why Bother Customizing Your Jenkins Dashboard?
Transforming your Jenkins dashboard from a simple status page into a truly insightful hub is a game-changer for any CI/CD pipeline. The standard view shows you a list of jobs, but it's missing the context you need to make quick, smart decisions. A custom dashboard fixes this by bringing the most important information for your projects right to the forefront.
This isn't just about making things look pretty; it's about building a focused control panel that actively helps your development workflow. As one of the top open-source automation servers, Jenkins is used by around 32,750 verified companies across the globe, from manufacturing to finance. It's incredibly flexible. If you're curious, you can explore more data about Jenkins usage to see just how wide its impact is.
The Real-World Benefits of a Tailored Dashboard
A well-designed dashboard has a direct and immediate impact on your team's productivity and the overall visibility of your projects. Instead of wasting time digging through logs or clicking into individual job pages, developers can get a snapshot of pipeline health instantly.
Here’s what you stand to gain:
- Crystal-Clear Visibility: See the status of every relevant build, test, and deployment in one unified view. No more hunting for information.
- Faster Problem Solving: Immediately spot failures, bottlenecks, and performance drops. This lets your team jump on issues before they snowball.
- Better Team Collaboration: Create shared dashboards that give everyone—from developers to project managers—the same understanding of a project's health and progress.
By creating specialized views, you turn your dashboard into an information radiator. This setup ensures that critical CI/CD metrics are always visible, fostering a culture of continuous improvement and accountability.
Ultimately, a personalized Jenkins dashboard gives your team the power to monitor, analyze, and fine-tune the entire software delivery process far more effectively. In the sections that follow, we'll get into the nitty-gritty of installing plugins, configuring widgets, and integrating analytics to build the command center you actually need.
Securing Your Jenkins Environment
Before you can get to the fun part of building a powerful, customized Jenkins dashboard, you have to lock the place down. A fresh Jenkins installation is basically an open door, making your initial security configuration the most important first step you'll take. I’ve seen teams skip this, and it’s a mistake that can leave their entire automation server exposed.
The very first thing you should do after installation is secure access. Jenkins actually walks you through creating an initial administrator user, and this is a critical moment. It's the step that switches the instance from an unprotected free-for-all to a managed environment. That initial user holds the keys to the kingdom, so treat those credentials with the respect they deserve.
This flow chart nails the essential sequence for securing a new Jenkins instance.
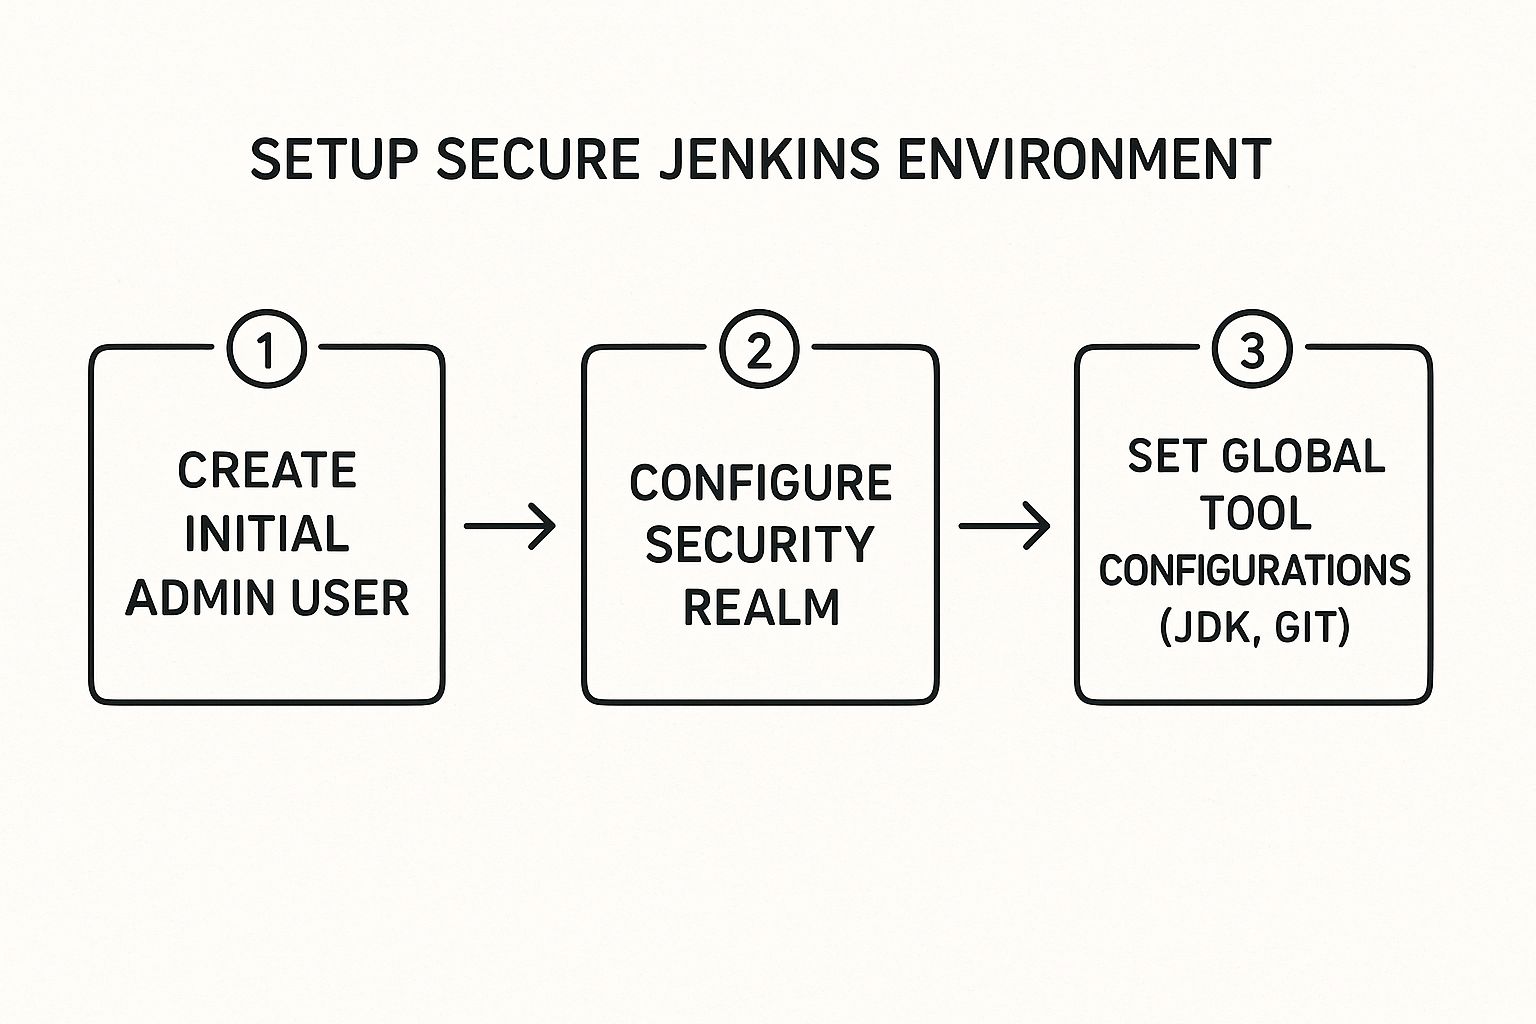
Following this order ensures you've established a security baseline before adding any project configurations, which is the right way to prevent unauthorized access from day one.
Configuring Security Realms and Authorization
With your admin user in place, the next move is to define how everyone else will get in and what they'll be allowed to do. You'll handle this in the Configure Global Security section, found under Manage Jenkins. This is where you set up a "security realm"—Jenkins's term for the method it uses to verify who someone is.
While the default "Jenkins’ own user database" works just fine for small teams or a personal project, most organizations will want to integrate with an identity provider they already use.
- LDAP Integration: This is a classic. It connects to your company's directory service, like Active Directory, so everyone can log in with their standard corporate credentials. No new passwords to remember.
- SAML or OAuth: For a more modern approach, you can set up single sign-on (SSO) by integrating with providers like Okta, Azure AD, or Google. This centralizes access management and is generally the cleaner solution.
Once you’ve sorted out authentication, you need to tackle authorization—what people can do. The Matrix-based security strategy is your best friend here. It offers incredibly granular control, letting you define specific permissions for individual users or entire groups. For instance, you could give a developer read-only access to a production pipeline while giving them full control over jobs tied to their own feature branch.
Setting up a proper security realm and authorization matrix isn't just about blocking bad actors. It’s about creating a clean, organized, and safe environment for your team to build and deploy software. It’s a foundational piece of CI/CD security.
If you're looking to go deeper on this topic, there are some great resources that cover CI/CD security best practices that go well beyond this initial setup.
Setting Up Global Tool Configurations
Okay, one last bit of housekeeping before you start creating jobs. You need to tell Jenkins where to find all its tools. Head over to Manage Jenkins > Global Tool Configuration. Here, you can define the locations for different versions of the JDK, Git, Maven, and any other command-line tools you'll be using.
By configuring these globally, you ensure all your pipelines can access them consistently without anyone hardcoding paths into their individual job configurations. Trust me, this small step will save you countless hours of troubleshooting down the line and makes your Jenkins setup far more maintainable.
Customizing Views with Dashboard Plugins
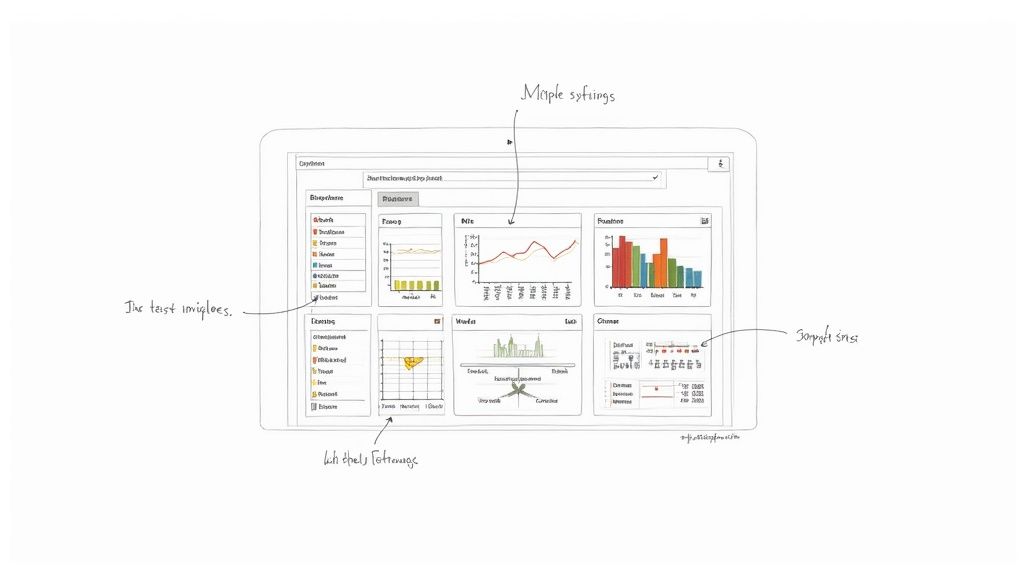
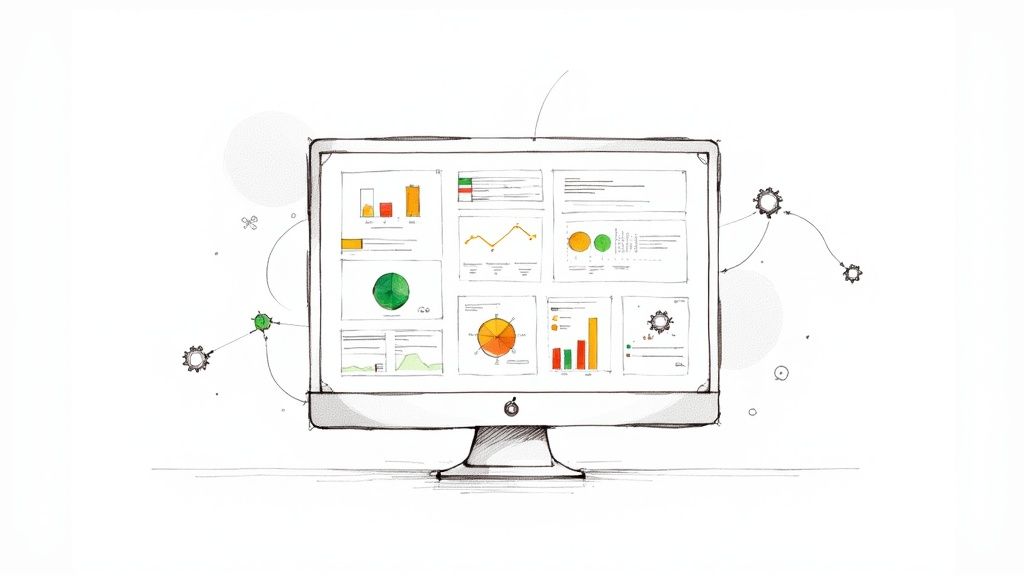
The image above gives you a taste of what’s possible with the Dashboard View plugin. It breaks free from the default job list, showing distinct "portlets" for build history, job status, and test trends all in one place. This modular approach is exactly how you escape the one-size-fits-all Jenkins experience.
Now we're getting to the fun part—the real heart of customization. The magic of Jenkins really comes alive through its incredible plugin ecosystem. This is where you stop looking at a generic list of jobs and start building a focused, role-specific command center that puts the right information in front of the right people.
Instead of your entire team squinting at the same cluttered view, plugins let you create multiple, distinct dashboards. Your QA team might need a view dedicated to test results and performance trends. Meanwhile, your frontend team probably just wants a clean dashboard showing their specific build pipelines.
Creating Tailored Dashboards with Dashboard View
The first plugin you’ll want to grab is Dashboard View. It’s the essential tool that unlocks the ability to create multiple dashboards, each with a unique layout and its own set of information widgets (or "portlets," as Jenkins calls them).
Installation is a breeze—just head to the Jenkins Plugin Manager. Once it's installed, a new option will pop up when you click the "+" tab on your main dashboard. Select "Dashboard View," give it a meaningful name like "Frontend Team Builds" or "QA Test Results," and you've got a blank canvas to work with.
From here, you can start adding portlets to bring your new view to life. The real power is in mixing and matching the right portlets to surface the most critical data for that dashboard's specific audience.
Here are a few of the most useful portlets to get you started:
- Jobs Grid: This gives you a configurable grid of your Jenkins jobs, showing their name, build status, and the "weather report" for recent build stability.
- Test Statistics Chart: Perfect for QA, this creates a pie chart breaking down passing, failing, and skipped tests across a set of jobs.
- Build Statistics: This one is great for tracking historical data, helping you spot trends in build times or failure rates over time.
- Filtered Jobs List: Incredibly useful for focus. You can use regular expressions to include only jobs that match a certain pattern, like
frontend-.*or.*-production.
By thoughtfully combining these portlets, you can build a highly effective continuous integration dashboard. For more ideas on what makes a great dashboard, you might find this article on designing a great continuous integration dashboard useful, as it covers principles that apply perfectly here.
Building a High-Visibility Information Radiator
While Dashboard View is perfect for detailed, data-rich dashboards, sometimes you need something simpler and more dramatic. I'm talking about the big monitor in the team space, where the goal is at-a-glance visibility for everyone.
This is where the Build Monitor View plugin shines.
This plugin creates a full-screen, highly readable "information radiator" that makes the status of your key jobs impossible to miss. It’s designed for maximum impact, using large, color-coded cards that flash bright red when a build fails. It even shows the avatar of the person who committed the code that broke the build.
The Build Monitor View is more than just a status screen; it's a powerful tool for building team accountability. When a build breaks and someone's face is on the big screen, it creates a gentle but effective nudge to fix the problem quickly.
Setting it up is just as simple as the Dashboard View. You create a new view, select "Build Monitor View," and then tell it which jobs to watch. This type of Jenkins dashboard is excellent for fostering a collective sense of ownership over the build process and keeping the whole team aligned on the health of your pipelines.
Integrating Advanced CI and Analytics
A great Jenkins dashboard is so much more than a wall of green and red dots. It should tell the real story of your project's health, giving your team insights they can actually use, not just a simple pass/fail status. This is where you level up from basic build monitoring and turn your dashboard into a true hub for quality and performance.
By pulling in plugins that surface deep analytics, you start catching problems long before they become emergencies. Instead of just reacting to failures, you're now proactively tracking trends in code quality, spotting performance regressions, and keeping an eye on compiler warnings. These metrics become an unavoidable, visible part of everyone's daily workflow.
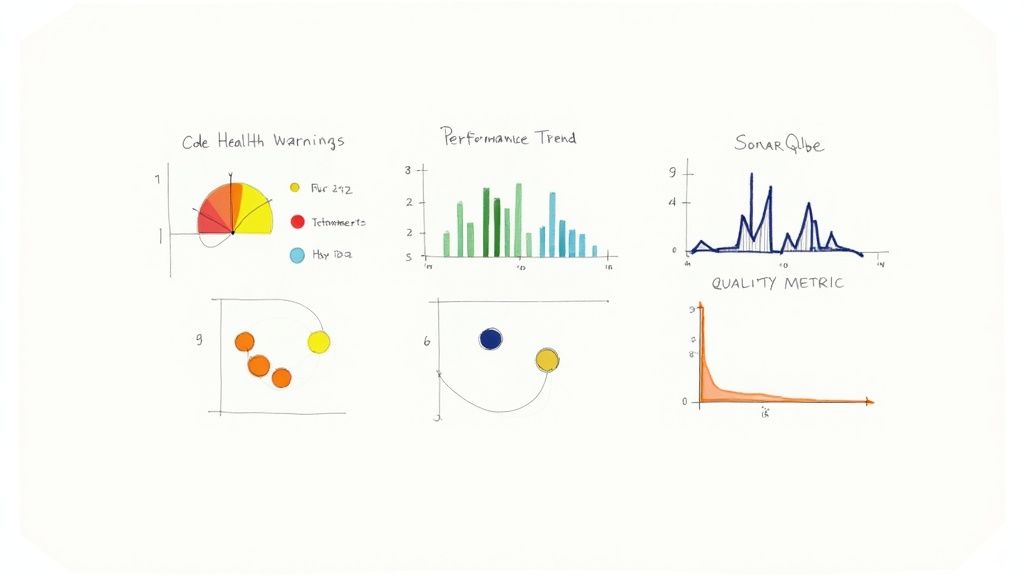
Surfacing Code Health with Warnings Next Generation
One of the most powerful tools in this space is the Warnings Next Generation plugin. It’s a total game-changer, collecting and visualizing reports from dozens of different static analysis tools. Think of it as your central command for every warning generated during a build.
No longer do developers have to sift through endless console logs to find a stray compiler warning or static analysis issue. This plugin yanks them out and puts them front and center. You can easily configure your Jenkins dashboard to show trend graphs of new, fixed, and outstanding warnings over time.
The impact of this visibility is huge. When the number of warnings is a metric everyone sees on the project dashboard, it creates a real incentive to maintain code hygiene. You can even set up your pipeline to fail the build if new warnings cross a certain threshold, essentially automating your quality standards.
To help you decide which tools best fit your needs, here's a quick comparison of some essential dashboard plugins.
Comparison of Key Jenkins Dashboard Plugins
| Plugin Name | Primary Use Case | Best For |
|---|---|---|
| Warnings Next Generation | Aggregates and visualizes static analysis reports. | Teams wanting to track and reduce compiler warnings and static analysis issues over time. |
| Performance Plugin | Parses and graphs results from load testing tools. | Engineers focused on catching performance regressions and tracking metrics like response time. |
| SonarQube Scanner | Integrates SonarQube analysis into Jenkins builds. | Organizations that need a comprehensive view of code quality, including bugs, vulnerabilities, and coverage. |
| Build Monitor View | Provides a highly visible, "radiator" style view of build statuses. | Displaying the real-time status of critical pipelines on a large screen in the office. |
These plugins work together to transform a basic Jenkins setup into an intelligent, proactive monitoring system.
Tracking Performance Trends Over Time
It's nearly impossible to catch performance regressions early without historical data. This is exactly what the Performance Plugin was built for. It parses results from popular load testing tools like JMeter and Taurus and plots the key metrics right on your dashboard.
This gives you a clear view of performance trends with every single build. Imagine a developer pushes a new feature, and the dashboard graph immediately shows a 15% spike in average response time. That instant feedback lets the team pinpoint the exact commit that caused the slowdown, making a fix or rollback incredibly fast.
Here’s how it helps build a performance-aware culture:
- Visualizes Key Metrics: You can track average response time, error percentage, and throughput over time.
- Sets Performance Budgets: Configure builds to become unstable or even fail if performance drops below a set threshold.
- Identifies Regressions Instantly: The trend graph makes it painfully obvious when a recent change has hurt performance.
When performance becomes a first-class citizen on your Jenkins dashboard, you stop putting out fires and start managing performance proactively.
Your Jenkins dashboard should tell a story about your project's health. Integrating analytics plugins turns that story from a simple "pass/fail" narrative into a detailed chronicle of quality, performance, and stability over time.
Creating a Comprehensive Quality Hub with SonarQube
For the complete picture of code quality, you'll want to integrate a dedicated platform like SonarQube. The SonarQube Scanner for Jenkins plugin makes this connection a breeze. It lets you trigger a SonarQube analysis as part of your pipeline and then pipe the results directly onto your Jenkins dashboard.
This integration adds a "Quality Gate" status to your builds, giving you a clear, consolidated view of metrics like code smells, bugs, vulnerabilities, and code coverage. Having this gate status right on your project dashboard ensures that code quality is never an afterthought. These integrations are fundamental to building solid CI/CD pipelines, and you can learn more about combining these tools in our detailed guide on CI/CD with Jenkins and Docker.
Best Practices for a Healthy Jenkins Environment
As your team starts to lean more heavily on Jenkins, you'll notice something: your instance can quickly morph from a nimble assistant into a tangled, slow-moving beast. Keeping it healthy isn't just about tinkering with settings. It's about building good habits that ensure your Jenkins setup can scale and stay stable for the long haul.
A clean, well-managed environment has a direct, visible impact—it makes your Jenkins dashboard more responsive, reliable, and genuinely useful.
It All Starts with Jenkins as Code
The single most impactful change you can make is to stop clicking around the UI and start treating your configuration like source code. This philosophy, widely known as Jenkins as Code, is all about moving your setup details out of the web interface and into files you can check into Git.
Why does this matter so much? Because manually configuring jobs and system settings is a ticking time bomb. It feels fast at first, but when you need to spin up a new instance or recover from a disaster, you’re left trying to remember every checkbox you ticked months ago. It's a recipe for inconsistency and pain.
There are two pillars to getting this right:
- Pipeline Scripts: Ditch the old Freestyle projects. Instead, define all your build, test, and deployment logic in a
Jenkinsfile. This script lives right alongside your application's source code, which means your CI/CD pipeline gets all the benefits of version control—it can be reviewed, versioned, and easily reused. - Jenkins Configuration as Code (JCasC): This brilliant plugin takes the idea a step further. It lets you define your entire Jenkins configuration—from security realms and credentials to agent setups and tool locations—in simple, human-readable YAML files.
When you fully embrace JCasC, you gain the power to stand up a complete, production-ready Jenkins instance from a single set of version-controlled files. This is a game-changer. Your setup becomes reproducible, auditable, and just plain easier to manage at scale.
Tame Your Plugins and Always Have a Backup Plan
The massive plugin ecosystem is one of Jenkins' biggest draws, but it's also a double-edged sword. It's so easy to install a dozen plugins for a trial run and then completely forget about them. This "plugin sprawl" chews up resources, makes your instance agonizingly slow to start, and can even poke holes in your security.
Make it a habit to periodically audit your installed plugins. A great little tool for this is the Plugin Usage plugin, which shows you what’s actually being used versus what’s just collecting dust. Be ruthless. If you don't absolutely need it, get rid of it. A leaner plugin set almost always means a faster, more secure Jenkins.
Finally, a solid backup strategy is completely non-negotiable. At the bare minimum, you need to be backing up your JENKINS_HOME directory on a regular schedule. This folder is the heart of your instance, containing all your job configs, build history, and plugin settings. When you combine this with a Jenkins as Code approach, you have a powerful one-two punch for disaster recovery.
As your setup gets more complex, the time your team sinks into maintaining Jenkins, updating plugins, and chasing down weird issues starts to add up. That's time they aren't spending on your actual product. This pain point has fueled a huge rise in managed Jenkins services. In 2024 alone, the North American market for these services ballooned to nearly USD 420 million, a clear signal that companies are eager to offload this operational headache. You can discover more insights about the managed services market on DataIntelo.
Common Jenkins Dashboard Questions
As you get your hands dirty customizing the Jenkins dashboard, you'll probably run into a few common questions. It happens to everyone. Let's walk through some of the most frequent ones I hear to clear things up and get you back to building.
One of the first things teams realize is that the single, default view just doesn't cut it. You need different dashboards for different folks—one for the backend team, another for QA, and maybe a high-level one for project managers.
How Can I Create Multiple Dashboards?
The secret to creating multiple, specialized dashboards is the Dashboard View plugin. Honestly, it's a must-have for any serious Jenkins setup.
Once you’ve installed it from the Plugin Manager, just look for the little + icon on your main Jenkins page. Click it, and you'll see an option to create a new view. Just select "Dashboard View," give it a name that makes sense (like "Backend Team" or "QA-Metrics"), and you're off to the races. From there, you can start adding and arranging different "portlets"—things like a job grid or a test statistics chart—to build out a view that's perfectly suited for a specific project or team.
This modular approach is the key to a truly effective Jenkins dashboard. It lets you deliver targeted information, making sure each person sees the metrics that matter most to their role without getting bogged down by noise from other projects.
Getting this separation right is absolutely critical for keeping things clear and focused as your Jenkins instance scales.
What Is the Best Plugin for a Build Monitor?
If you're looking for something to display on a big screen in the office or team area, you can't do better than the Build Monitor View plugin. It was designed from the ground up to be an "information radiator."
This plugin gives you a super clean, minimalist, and highly readable display of your job statuses. It uses big, color-coded cards that make it immediately obvious which builds are running, stable, or broken. The whole design is optimized for at-a-glance understanding, even from across the room. It also famously shows the avatar of the person whose commit broke the build, which adds a nice touch of friendly accountability.
Can I Add Code Quality Metrics to My Dashboard?
Absolutely, and you definitely should. Weaving code quality metrics into your dashboard turns it from a simple build server into a real quality hub. The most popular way to pull this off is by connecting Jenkins to a platform like SonarQube using the SonarQube Scanner for Jenkins plugin.
After you configure the plugin to talk to your SonarQube server, you can add a "Quality Gate" check to your pipelines. This gate automatically evaluates your code against a set of quality standards you define. The results—including summaries of bugs, vulnerabilities, and code coverage—can then be piped directly onto your project dashboards. This makes code quality an unmissable part of your CI process.
Tired of managing complex CI pipelines and surprise costs? Mergify offers a powerful Merge Queue and CI Insights to streamline your workflow, secure your code, and stop developer frustration in its tracks. See how we can optimize your CI/CD process.