A Guide to Monitoring Web Applications

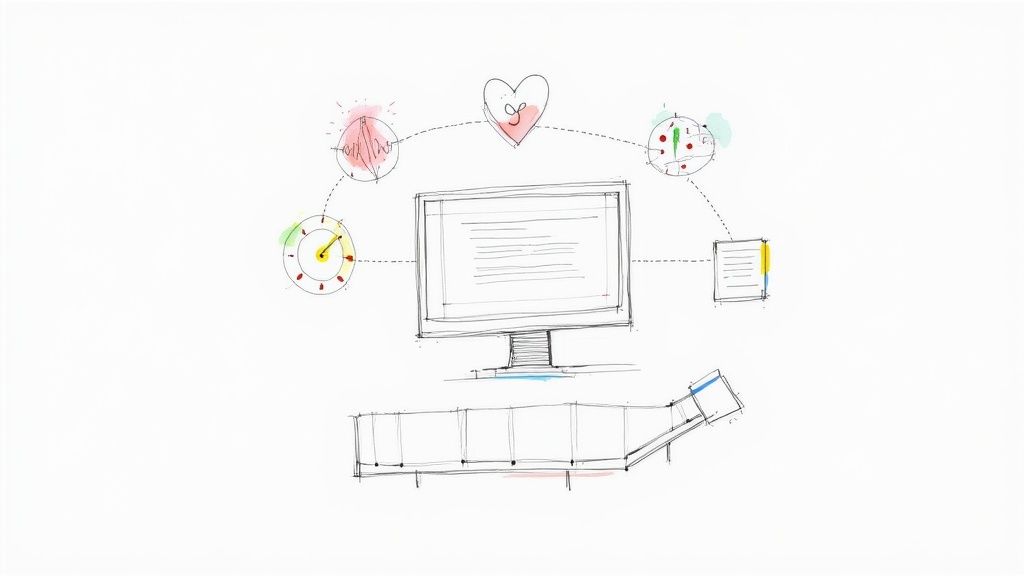
Monitoring a web application is all about keeping your finger on its pulse. You're tracking key performance metrics to make sure your app is fast, reliable, and always available for your users. Think of it like a pilot's cockpit dashboard—it's giving you all the critical data you need to fly safely and spot trouble before it turns into a nosedive.
Why You Cannot Afford to Ignore Web App Monitoring
Trying to run a modern web app without a solid monitoring strategy is like flying blind. It's a massive business risk. In today's market, user experience is everything. When your application crashes, slows to a crawl, or just acts weird, people get frustrated. And frustrated users leave, which directly hits your revenue and tanks your brand's reputation.
Good monitoring flips the script, moving your team from reactive firefighters to proactive problem-solvers. Instead of waiting for a flood of angry user tickets to tell you something's wrong, you can spot and diagnose issues before they ever impact a large chunk of your audience. That kind of visibility is the secret to maintaining a smooth, high-quality experience that keeps customers coming back.
From Simple Checks to Full Visibility
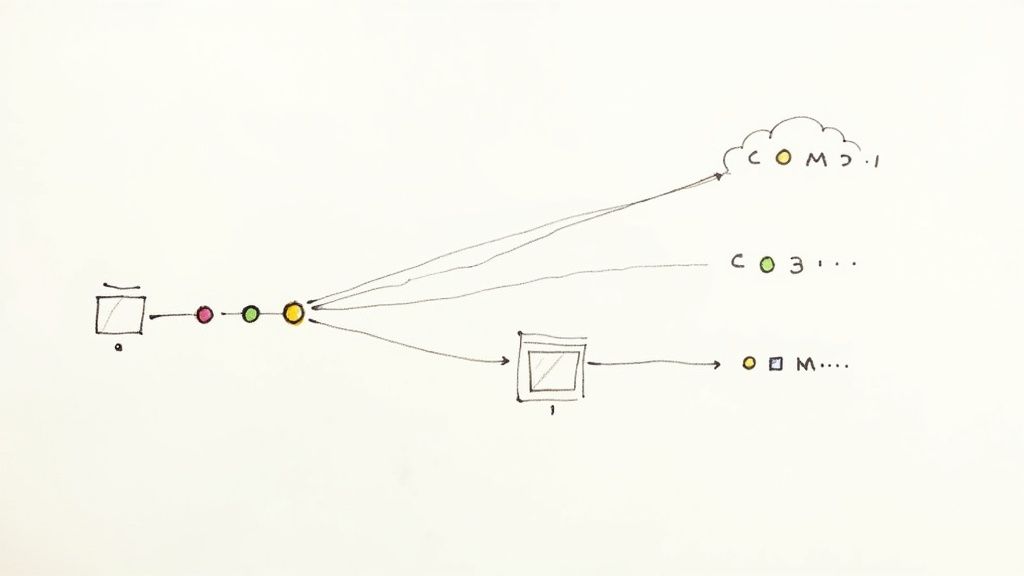
The world of monitoring has come a long way. The early days were all about simple uptime checks—basically, just pinging a server to ask, "Hey, are you online?" While that's better than nothing, it completely fails to capture the complexity of today's distributed applications. Modern apps are intricate webs of microservices, third-party APIs, and dynamic cloud infrastructure.
A failure in one tiny component can create a ripple effect, causing a performance slowdown that a basic "ping" test would never even notice. This is why monitoring web applications has evolved into a much more complete approach known as observability. It’s a deeper strategy that lets teams see not only that something is wrong but also understand exactly why it's happening.
Monitoring isn't just a technical chore anymore; it's a core business strategy. It delivers the insights needed to draw a straight line from application performance to user satisfaction and business growth.
An Essential Business Investment
You don't have to take my word for it—just look at the numbers. The global application performance monitoring (APM) market was valued at a whopping $9.04 billion in 2024 and is on track to hit $21.30 billion by 2032. This explosive growth shows just how indispensable real-time visibility has become for businesses of all sizes. You can read more about the growth of the APM market to see the full picture.
Ultimately, putting money and effort into a proper monitoring setup pays off in several huge ways:
- Improved Reliability: You minimize downtime and make sure your application is there when users need it.
- Faster Issue Resolution: You can pinpoint the root cause of problems in minutes, not hours, slashing your Mean Time to Resolution (MTTR).
- Enhanced User Experience: A faster, more stable app keeps users engaged and happy.
- Informed Business Decisions: Performance data helps guide your development priorities and shape smarter strategic plans.
Understanding the Three Pillars of Observability
When something goes wrong with your web application, how do you figure out what's happening? Just looking at a single stream of data won't cut it. To get the full story, you need to see the problem from multiple angles. This is the core idea behind observability, which stands on three foundational pillars.
Think of it like being a doctor for your application. A good doctor doesn't just check your temperature and call it a day. They look at your vital signs, run specific diagnostic tests, and review your entire medical history. Only then can they pinpoint the root cause. Your application is the patient, and these three pillars are your diagnostic tools.
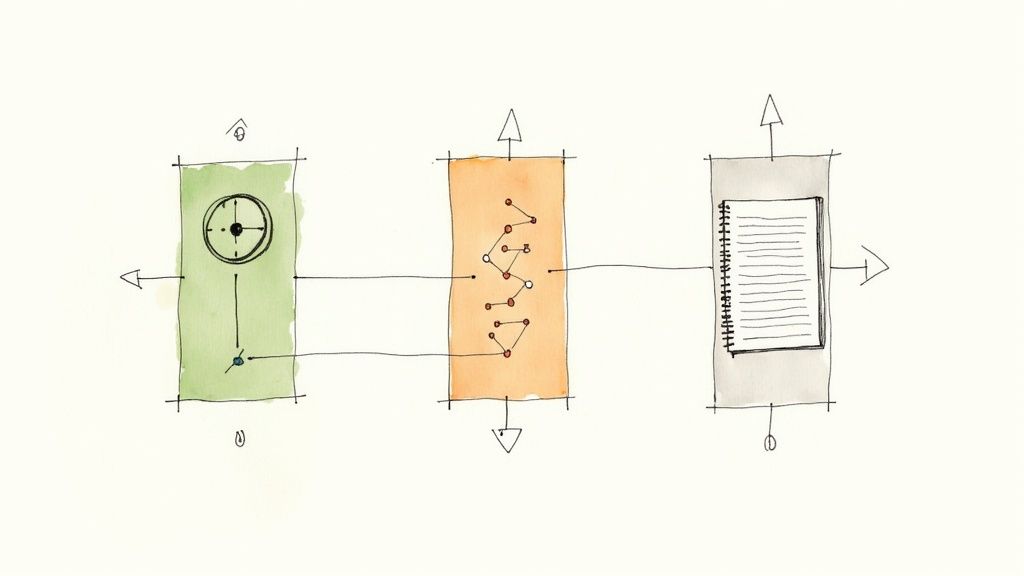
Each pillar answers a different kind of question, giving you a layered view that takes you from a 30,000-foot overview right down to the nitty-gritty details. Let's break them down.
Pillar 1: Metrics Are Your Application's Vital Signs
Metrics are the vital signs of your application. Like a patient's heart rate, blood pressure, and temperature, metrics give you a quick, numerical snapshot of your system's health at any given moment. They are aggregated data points collected over time, which makes them perfect for spotting trends and catching high-level problems.
These are the numbers you slap onto a dashboard to see, at a glance, if everything is running smoothly. For instance, if you see CPU usage suddenly jump to 95%, you know something’s wrong immediately, even if you don't know the exact cause just yet.
Common examples of metrics include:
- CPU and Memory Usage: How much of your server's horsepower is your application using?
- Request Throughput: How many requests is your application handling per minute?
- Error Rate: What percentage of requests are failing?
Metrics are fantastic for telling you that something is wrong, but they rarely tell you why. To get that answer, we need to follow the trail of a request as it moves through your system.
In web application monitoring, metrics are your first line of defense. They’re the early warning system that blinks red, signaling that it’s time to start digging deeper.
Pillar 2: Tracing Maps the Entire Journey
If metrics are the vital signs, then distributed tracing is like mapping the patient's entire circulatory system. It follows a single user request from the moment it hits your frontend all the way through every service it touches—the API gateway, the authentication service, the database—and back again.
This gives you a beautifully detailed, end-to-end view of a request's life. Each step in this journey, called a "span," is timed, allowing you to pinpoint exactly where the slowdowns are. If a page is taking forever to load, a trace will show you precisely which microservice or database query is the culprit. To go even deeper, check out the fundamentals of software observability and its components.
A trace helps you answer questions like:
- Which service is causing the bottleneck for this specific user's request?
- How long did that database query really take for this API call?
- What was the exact path a request took through our mess of microservices?
Pillar 3: Logs Provide the Detailed History
Finally, if metrics are the vitals and traces are the circulatory map, logs are the patient's detailed medical history. They are timestamped, text-based records of specific events that happened inside your application. Each log entry provides the granular context you need to understand what was happening at a precise moment in time.
When a trace shows you where a problem occurred, the logs from that service will tell you why. A log might contain a critical error message, a full stack trace, or contextual details about a user's action that triggered the failure.
Logs are indispensable for deep-dive investigations. They aren't aggregated like metrics; they are discrete, individual events that provide the ground-level truth. Sifting through millions of log lines used to be a nightmare, but modern logging platforms make it easy to search, filter, and analyze this data to find the exact smoking gun you need to fix the issue.
To tie this all together, here's a quick cheat sheet for the three pillars.
The Three Pillars of Monitoring Explained
| Pillar | Analogy | What It Measures | Question It Answers |
|---|---|---|---|
| Metrics | Vital Signs | Aggregated numerical data over time (CPU, memory, error rate) | Is something wrong? |
| Traces | Circulatory System Map | The end-to-end journey of a single request across services | Where is the problem happening? |
| Logs | Detailed Medical History | Timestamped, granular events and contextual messages | Why did the problem happen? |
By combining these three data sources, you move from just monitoring (knowing if something is broken) to true observability (understanding why it broke). This complete picture is what empowers you to build more resilient, reliable, and performant web applications.
Tracking the Metrics That Actually Matter
So, you've got data flowing from your application. Now what? It's incredibly easy to get lost in a sea of graphs and numbers, a classic case of information overload. The secret to effective monitoring isn't tracking everything; it's tracking the right things.
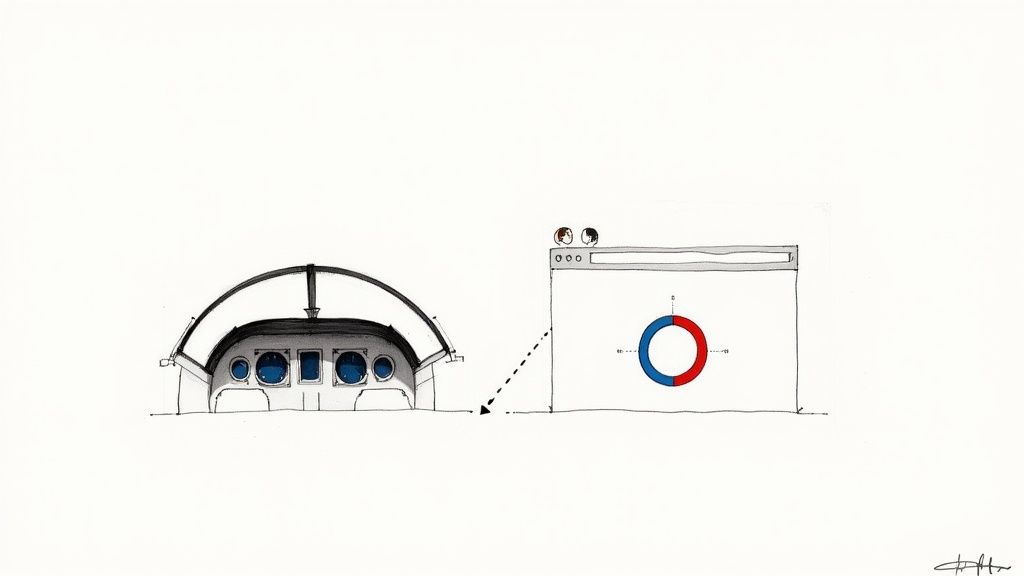
Focusing on a handful of key performance indicators (KPIs) is like having a clean, simple dashboard for your application. These are your primary flight instruments—the essential dials that tell you if you're flying smoothly or heading for trouble. They cut through the noise and give you a clear, actionable picture of your app's health.
To make this practical, let's break these critical metrics into three distinct categories. Each one offers a different lens for viewing your application's performance, from what the user sees on their screen all the way down to the business's bottom line.
User-Facing Performance Metrics
These are the numbers that tell you what your users are actually experiencing. If these metrics look bad, it's a sure sign your users are feeling the pain, which quickly leads to frustration, bad reviews, and churn. A slow, buggy experience is the fastest way to lose a customer.
Here are the essentials to keep an eye on:
- Core Web Vitals: This is Google's own set of metrics for measuring real-world user experience, focusing on loading performance, interactivity, and visual stability. They include Largest Contentful Paint (LCP), First Input Delay (FID), and Cumulative Layout Shift (CLS). Hitting good scores here isn't just for user happiness—it directly impacts your SEO ranking.
- Apdex Score: Think of the Application Performance Index (Apdex) as a simplified satisfaction score. It boils down tons of measurements into a single number that tells you if users are "satisfied," "tolerating," or "frustrated." An Apdex score of 0.94, for instance, means 94% of user interactions are hitting your performance targets.
- Page Load Time: It’s a classic for a reason. This metric measures the total time it takes for a page to become fully interactive. While simple, it’s still one of the most powerful indicators of overall performance.
Monitoring these numbers is a great start. To get the full story, you'll want to dig into how a real user monitor captures this data directly from your audience's browsers, giving you a true picture of their digital journey.
Application Health and Stability Metrics
While user-facing metrics tell you what is happening, these metrics tell you why. These are the vital signs of your backend systems, your infrastructure, and your code itself. They give you a pulse on the internal health of your application and often act as an early warning system before problems bubble up to the user.
Tracking application health is like a regular check-up for your codebase. It helps you catch underlying conditions before they become critical failures that impact your entire user base.
Here are the vitals you need to watch:
- Error Rate: This is the percentage of requests that fail, like a 500 Internal Server Error or a 404 Not Found. A sudden spike here is often the very first sign of a bad deployment or a failing service.
- Request Throughput: Measured in requests per minute (RPM), this shows you how much traffic your application is handling. Keeping an eye on throughput helps you spot usage patterns and is crucial for capacity planning. A sudden, unexpected drop could point to a network issue or a problem with a load balancer.
- CPU and Memory Utilization: These are the fundamentals. They track how much of your server resources your application is hogging. If utilization is consistently high, performance will suffer. It's a clear signal that you either need to scale up your infrastructure or hunt down some inefficient code.
Business Impact Metrics
At the end of the day, your application exists to serve a business goal. This final group of metrics connects the dots between how your code is running and how the business is doing. When you correlate these KPIs with your application health data, you can uncover powerful, and often surprising, insights into how performance directly affects your bottom line.
For example, if you can show that the conversion rate drops every time your page load speed increases by 500ms, you suddenly have a crystal-clear, data-driven case for prioritizing performance work.
Key business-oriented metrics include:
- Conversion Rate: This is the percentage of users who do what you want them to do—sign up, make a purchase, or fill out a form. It's often the most direct link between application performance and revenue.
- User Churn Rate: This tracks the percentage of users who stop using your app over a certain period. High churn can often be traced back to a poor, unreliable, and frustrating user experience.
- Active Users: Tracking daily or monthly active users gives you a sense of engagement and growth. A sudden dip in this number, without a clear reason, can sometimes be an early warning of a persistent performance issue.
By organizing your monitoring around these three areas, you build a complete, holistic view. You can see exactly how a spike in CPU usage (application health) leads to slower page loads (user-facing performance), which in turn causes a drop in sales (business impact). This end-to-end visibility is what transforms monitoring from a purely technical chore into a powerful business tool.
Building a Modern and Scalable Monitoring Stack
Building a solid monitoring strategy is like designing a central nervous system for your application. It has to be fast, reliable, and capable of growing right alongside you. A system that’s just a mishmash of disconnected tools will quickly turn into a liability, creating data silos and making it impossible to see the whole picture.
A truly scalable monitoring stack is built in layers, and each layer has a very specific job. This layered approach ensures every bit of data is collected, processed, and served up in a way that helps your team act fast. This isn't just about hoarding data; it's about turning that data into real, actionable intelligence.
The Foundational Layers of Monitoring
A robust monitoring system really boils down to three core layers that work together. Each one builds on the last, transforming a flood of raw data into clear, understandable insights.
- Data Collection: Think of this as the sensory network of your system—the nerve endings. Agents, libraries, and exporters get installed on your servers, inside your containers, and even within your application's code. Their single job is to gather the "three pillars" of observability data—metrics, logs, and traces—from every corner of your environment.
- Data Processing and Storage: This is the brain of the whole operation. Once collected, that massive volume of telemetry data is sent here to be indexed, aggregated, and stored efficiently. This layer often relies on specialized databases, like a time-series database (Prometheus, for example) for metrics and a search engine (like Elasticsearch) for logs.
- Visualization and Alerting: This is the system's reflex and communication center. Raw data is pretty useless if you can't understand it. This is where visualization tools like Grafana step in, turning all that stored data into dashboards and graphs you can actually read. The alerting system (like Alertmanager) is constantly watching for problems and fires off notifications to get the right eyes on an issue, right away.
This infographic does a great job of breaking down the hierarchy of what you're really monitoring, from the user's experience all the way down to the business impact.
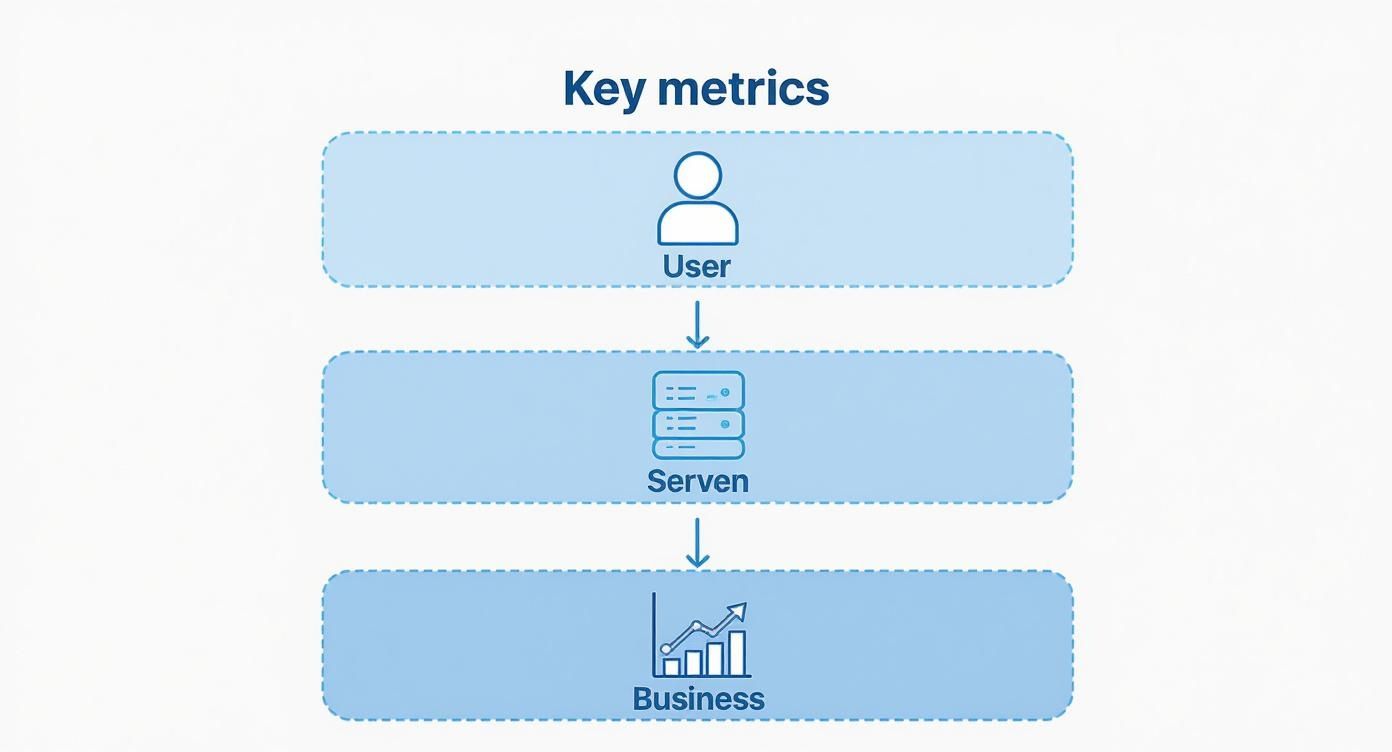
This structure really hammers home how technical metrics at the app level directly affect both your end-users and your bottom line.
Choosing Your Monitoring Tools
When you're picking the tools to power these layers, you’ve basically got two main paths: build your own stack with open-source tools or buy into a unified Software-as-a-Service (SaaS) platform. Both have their pros and cons.
Going the open-source route gives you incredible flexibility and control over costs. You can mix and match the best tools for the job to build a system that’s a perfect fit for your specific needs.
A popular open-source combo is the "PLG" or "PEG" stack:Prometheus for collecting and storing metrics.Loki for log aggregation.Grafana for visualizing everything.Jaeger or Tempo for distributed tracing.
This setup gives you powerful capabilities without getting locked into a single vendor, but be warned: it takes a significant amount of engineering effort to get it running, maintain it, and make sure it scales.
The Power of Unified Platforms
On the other side of the coin, you have SaaS platforms like Datadog, New Relic, or Dynatrace that offer a "single pane of glass" experience. They bundle everything—agents, storage, visualization, and AI-powered analytics—into one cohesive product. This dramatically cuts down on the maintenance headache for your team.
The trade-off, of course, is cost and a bit less granular control compared to a self-hosted stack. But for many teams, the speed and simplicity of a managed platform are well worth the price. As cloud computing and microservices have become the norm, these platforms have become more essential than ever.
You can see this trend in the market’s explosive growth. In 2023, the global APM software market was valued at $5.36 billion and is projected to grow at a compound annual growth rate of 14.3% through 2030. This boom is driven by the sheer complexity of modern, distributed applications. You can dig deeper into these market dynamics and their implications if you're curious.
Ultimately, the right choice comes down to your team’s size, expertise, and budget. Whether you build it yourself or buy a subscription, the goal is the same: to get a unified, scalable view of your application’s health so you can solve problems before they ever reach your users.
Integrating Monitoring into Your CI/CD Pipeline
The best approach to monitoring a web application is to be proactive, not reactive. For years, the standard model was to wait for frustrated users to report a problem after a deployment. That’s a terrible way to discover performance issues. Modern development flips this on its head with a simple but powerful idea: "Shift Left."
Shifting left just means moving testing and monitoring way earlier in the development process. You embed performance checks right into your Continuous Integration/Continuous Deployment (CI/CD) pipeline. Instead of waiting for a problem to pop up in the wild, you catch it automatically before the code even has a chance to merge. It’s a game-changer, turning monitoring from an operational chore into a tool that helps developers build better software from the get-go.
Catching Regressions Before They Ship
Picture this: a developer submits a pull request with a small, seemingly harmless change. In a classic workflow, it passes the unit tests, gets a thumbs-up, and is merged. A week later, production grinds to a halt. By building monitoring into your CI/CD pipeline, you can stop this from ever happening.
Think of it as a quality gate. Automated performance tests run on every single pull request, checking for common culprits like:
- Database Query Time: Did the change sneak in a slow or horribly inefficient query?
- API Response Latency: Are key endpoints suddenly taking much longer to respond?
- Memory Consumption: Is the new code eating up memory and creating a potential leak?
If any of these metrics dip below a set threshold, the pipeline can automatically block the merge. The best part? This gives instant, data-driven feedback right back to the developer inside their pull request. No more guesswork.
Empowering Developers with Immediate Feedback
Let’s walk through a real-world example. A developer refactors some code to make it cleaner and more readable. Looks great, and all the functional tests pass with flying colors. But the automated performance test in the CI pipeline tells a different story. It turns out this "improvement" accidentally created an N+1 query, causing the number of database calls to explode for a common user action.
Without this check, the issue would have slipped right through to production. Instead, the developer gets an immediate notification. The pull request is flagged with a clear, unmissable message: "Performance test failed: Database query count increased by 500%."
The screenshot below shows exactly how a tool like Mergify CI Insights can surface this critical data right inside a pull request, giving developers clear, actionable feedback when it matters most.
This kind of immediate visibility lets the developer see the problem, find the root cause, and fix it on the spot—long before a single user is affected.
Shifting performance monitoring left does more than just catch bugs; it fosters a culture of performance awareness. When developers can see the direct impact of their code on key metrics, they naturally start writing more efficient and resilient software.
This approach becomes even more powerful when you pair it with modern observability standards. For teams looking to build this kind of automated safety net, a great next step is to understand how to integrate OpenTelemetry within your CI/CD workflow. Automating these checks creates a tight feedback loop that ensures performance is always treated as a first-class feature, not an afterthought.
How AIOps Is Making Monitoring Smarter
Let's face it: as web applications get more complex and distributed, trying to monitor them manually is like trying to listen to every single conversation in a massive stadium at once. It's just not possible.
This is where AIOps, or Artificial Intelligence for IT Operations, comes in. It’s completely changing how we approach web application monitoring by adding a much-needed layer of intelligence. AIOps uses machine learning (ML) to automate and supercharge the whole process, acting like a brilliant detective sifting through millions of data points to find patterns and connections a human engineer would almost certainly miss. The goal is to move beyond just collecting data and start getting direct, actionable answers.
From Alert Overload to Clear Answers
One of the biggest headaches in traditional monitoring is "alert fatigue." When your systems spit out thousands of alerts, engineers get overwhelmed, and the truly critical signals get lost in the noise. AIOps tackles this problem head-on.
Here are three key ways it’s making monitoring a whole lot smarter:
- Automated Anomaly Detection: Instead of you manually setting static thresholds, AIOps learns what "normal" looks like for your application. It then automatically flags any weird deviations—like a sudden drop in transaction volume at 3 AM—that could be an early warning sign of trouble.
- Intelligent Alert Grouping: AIOps is smart enough to correlate related alerts from across your entire stack. So if a single database failure causes a cascade of 50 different alerts from various services, AIOps groups them into one single incident, pointing you straight to the root cause.
- Predictive Analytics: By analyzing historical trends, AIOps can actually forecast potential issues before they ever impact your users. It might warn you that a server is projected to run out of disk space in two days, giving you plenty of time to act proactively.
The real promise of AIOps is to replace a flood of raw data with a handful of clear, actionable insights. It helps engineers spend less time searching for problems and more time actually solving them.
The Business Impact of Smarter Monitoring
This shift toward AIOps isn't just a technical upgrade; it has a massive impact on the bottom line. Platforms are now using ML and large-language models to automate root-cause analysis, which can slash outage costs by up to 48%.
This is a huge reason why the broader monitoring tools market is expected to surge from $38.97 billion in 2025 to a whopping $69.57 billion by 2030. You can get a closer look at these trends in the monitoring tools market to see the full picture.
Ultimately, AIOps helps teams dramatically lower their mean time to resolution (MTTR). By pinpointing the true source of an issue in minutes instead of hours, you can ensure a far more stable and reliable experience for your users.
Got Questions About Web App Monitoring?
Jumping into web app monitoring can feel like learning a new language. A lot of terms get thrown around, and it's not always clear where to start. We hear the same questions pop up all the time from development and ops teams, so let's tackle a few of the big ones head-on.
What's the Real Difference Between Monitoring and Observability?
This is easily the most common point of confusion, and it’s a great question. The distinction is pretty simple when you think about it.
Monitoring is like watching the dashboard of your car. You're checking known, specific things—your speed, your fuel level, your engine temperature. You've set up alerts to tell you if something you already know about goes wrong, like the "check engine" light coming on. It answers the question, "Is the system working like I expect it to?"
Observability, on the other hand, is what you need when that "check engine" light is on, but you have no idea why. It's the ability to pop the hood and ask any question you want about what’s happening inside, even if you never thought to ask it before. Using the "three pillars"—metrics, logs, and traces—it helps you explore the unknown and get to the root cause of a problem.
How Do I Pick the Right Monitoring Tools?
There's no magic bullet here; the "best" tool is the one that fits your world. What works for a tiny startup running a monolith won't work for a massive enterprise with hundreds of microservices.
Before you pull out the company credit card, think through a few key things:
- Your Architecture: Is your app a single, straightforward monolith? Or is it a complex web of distributed microservices? The more distributed you are, the more you'll lean on tools that are killer at distributed tracing.
- Your Team's Bandwidth: Do you have engineers who can dedicate serious time to setting up and maintaining an open-source stack like Prometheus and Grafana? If not, a managed SaaS platform is probably your best bet.
- Budget and Scale: Open-source tools look cheap upfront, but the operational cost can be a killer. SaaS platforms like Datadog or New Relic have a subscription fee but give you a ton of power right out of the box.
The ultimate goal is to find a toolset that gives you a "single pane of glass"—one unified dashboard for your whole stack. The last thing you want is to be hunting for clues across a dozen different disconnected systems.
When Should I Actually Start Monitoring?
The honest answer? Yesterday. But since we can't time travel, the next best answer is day one.
When you build monitoring and observability into your application from the very beginning, you're making performance a core feature, not an afterthought you scramble to add later.
This "Shift Left" mindset is just plain smarter. It's way cheaper and more effective to catch issues early. When you integrate performance checks directly into your CI/CD pipeline, you empower developers to spot and squash problems long before they ever reach a user. That’s how you build truly resilient software.
Ready to bring clarity and intelligence to your CI/CD pipeline? Mergify's CI Insights provides the observability you need to identify and resolve infrastructure problems before they slow your team down. See how Mergify can streamline your workflow.