Build a Jenkins Grafana Dashboard That Works

A Jenkins Grafana dashboard is your command center for CI/CD, giving you a live, visual feed of your pipeline's health and performance. By hooking up Jenkins metrics with Grafana's slick visualization tools, you can finally stop putting out fires and start proactively tuning your entire build and deployment machine.
Why a Dedicated Dashboard Is a Game Changer
Let's be honest, a standard Jenkins setup can feel like flying blind. It's a black box. You know a build failed, sure, but can you easily spot a creeping increase in build times over the last month? Or pinpoint which agent is always overloaded? This is where a dedicated dashboard flips the script, turning vague problems into hard, actionable data.
This isn't about making pretty charts for the sake of it. It's about getting straight answers to critical questions. Are your build agents sitting idle and burning cash? Is one flaky test secretly torpedoing builds across multiple projects? These are the kinds of insights that separate high-performing teams from those stuck in a constant cycle of firefighting. For a deeper look at this concept, check out our guide on https://articles.mergify.com/what-is-infrastructure-monitoring/.
From Blind Spots to Actionable Insights
Without a proper dashboard, finding trends means digging through mountains of logs or, worse, just going with your gut. A Jenkins Grafana dashboard pulls all your key metrics into one place, making it dead simple to connect the dots.
- Build Duration Trends: Instantly see which jobs are getting slower over time. This lets you jump on performance regressions before they become massive blockers for your team.
- Queue Times: Long queue times are a huge red flag. It’s a clear sign you don't have enough build agent capacity, which means developers are just sitting around waiting.
- Agent Usage: Get a clear picture of which agents are overworked and which are collecting dust. This is crucial for smart resource allocation and cutting down on unnecessary costs.
This whole process is about turning raw numbers into smart improvements.
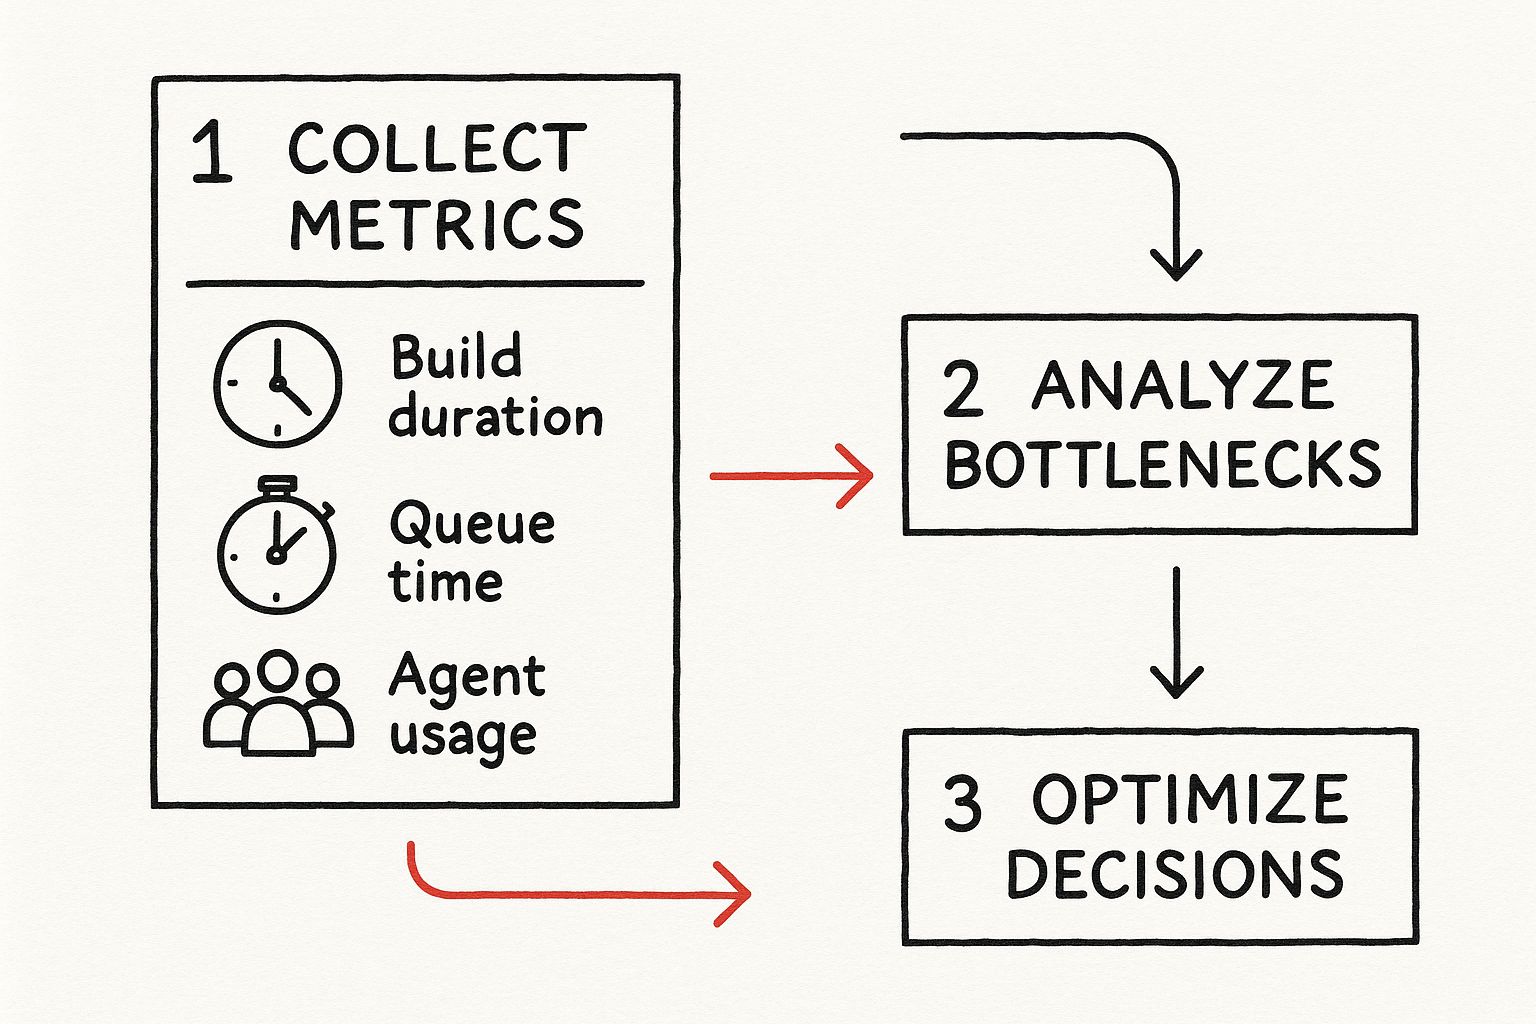
It’s a simple but powerful loop: collect the data, spot the bottlenecks, and make informed decisions. That's the heart of effective CI/CD observability.
To really drive home the difference, let’s compare the old way with the new.
From Manual Checks to a Real-Time Grafana Dashboard
This table breaks down how a dashboard fundamentally changes your approach to monitoring.
| Monitoring Aspect | Without a Dashboard (Manual Approach) | With a Jenkins Grafana Dashboard (Automated Insights) |
|---|---|---|
| Problem Detection | Reactive. You find out something is wrong after it breaks. | Proactive. You spot negative trends before they cause failures. |
| Trend Analysis | Manual, tedious log digging. Often based on guesswork. | Automated. Historical data is visualized, making trends obvious. |
| Resource Management | Inefficient. Agent capacity is based on "feel" or past failures. | Data-driven. Optimize agent usage and costs based on real-time data. |
| Time to Insight | Hours or even days. Requires significant manual investigation. | Seconds. Critical information is available at a glance. |
| Decision Making | Slow and often based on incomplete information. | Fast and confident, backed by clear, visual evidence. |
The contrast is pretty stark. You move from a state of constant reaction to one of strategic control.
Unifying Pipeline and Infrastructure Metrics
This isn't just a niche idea; it's where the industry is heading. A global observability survey recently found that a majority of teams are now using dashboards to bring pipeline and infrastructure data together. The Jenkins, Prometheus, and Grafana stack is a classic for a reason. In fact, up to 60% of organizations are ramping up investment in these tools specifically to slash the time it takes to detect pipeline issues.
The bottom line is this: a Jenkins Grafana dashboard is an essential tool for any team serious about improving its engineering productivity.
By seeing your metrics, you can finally shift from just reacting to failures to proactively optimizing the entire software delivery lifecycle. To really get into the weeds on this, have a look at this fantastic guide to engineering productivity measurement.
Exposing Jenkins Metrics With The Prometheus Plugin
Before you can build any kind of useful Jenkins dashboard in Grafana, you need the raw data. That data is locked away inside your Jenkins instance, and the key to getting it out is the Prometheus Metrics plugin. Think of this plugin as a translator—it takes all the internal events happening inside Jenkins and converts them into a clean, simple format that Prometheus can scrape and understand.
Getting it installed is about as easy as it gets. Just head over to Manage Jenkins > Plugins, find "Prometheus metrics" on the Available plugins tab, and click install. A quick restart of your Jenkins server is all it takes to bring it to life, instantly creating a new endpoint that’s ready to serve up a treasure trove of metrics.
Activating The Metrics Endpoint
With the plugin running, all that juicy data is now exposed at a specific URL: your-jenkins-url/prometheus. If you pop that URL into your browser, you should see a wall of text—lines and lines of metrics. This is the raw data feed your Prometheus server is going to pull from.
If you get a 404 error instead, the first thing to check is whether the plugin was installed correctly and if Jenkins was actually restarted. That's the most common culprit.
Just because the endpoint exists, though, doesn't mean your Prometheus server can see it. A very common hiccup I’ve run into is a firewall or a network security group blocking access. You have to make sure the port Jenkins runs on is open to traffic from your Prometheus server. Permissions can also trip you up, so confirm that scraping doesn't require authentication—or if it does, make sure your Prometheus config has the right credentials.
My personal tip is to always test connectivity right from the Prometheus server itself using a tool likecurl. Running a quickcurl your-jenkins-url/prometheusimmediately tells you if you're dealing with a network problem or a plugin issue. It has saved me countless hours of troubleshooting.
Key Metrics You Get Instantly
The moment you flip the switch on this plugin, you get immediate visibility into some of the most critical aspects of your CI/CD environment. This initial batch of metrics is more than enough to build a powerful baseline dashboard.
Here are a few of the most valuable metrics available right out of the box:
jenkins_job_duration_seconds: This tracks how long each build takes. It’s perfect for spotting when a change has slowed things down.jenkins_node_online_status: A simple up/down monitor for the health and availability of your build agents.jenkins_job_queuing_duration_seconds: This reveals how long jobs are sitting in the queue waiting for an executor. It’s a dead giveaway for resource bottlenecks.jenkins_job_total_count{result="FAILURE"}: A straightforward counter for failed builds, which is essential for any high-level health check.
These metrics are the foundation of good observability. Once you get comfortable with this data, you can start exploring more advanced topics, like how OpenTelemetry can provide even deeper insights into your CI/CD pipelines. If you're curious, this deep dive on OpenTelemetry for CI/CD is a great place to start.
Now that we have the data flowing, it’s time to get Prometheus configured to collect it.
Connecting Prometheus to Your Jenkins Instance
Now that your Jenkins instance is broadcasting its performance data, it's time to tell Prometheus where to find it. This is the crucial handshake where you make Prometheus aware of your Jenkins metrics endpoint. We’ll do this by adding a new "scrape job" to the main Prometheus configuration file, usually called prometheus.yml.
Think of this file as Prometheus's address book. You're simply adding a new entry for Jenkins, telling Prometheus exactly where to look and how often to check in for new data. Precision is key here—a single typo in the YAML file can stop Prometheus from finding its target, so we'll walk through it carefully. This configuration is what will ultimately feed the Jenkins Grafana dashboard we’re aiming to build.
Configuring the Scrape Job
First, you'll need to pop open your prometheus.yml file in your favorite editor. Inside, you'll find a section called scrape_configs. This is where we’ll add a new job definition.
Here’s a practical, ready-to-go block of code. Just copy this in and change the targets line to point to your Jenkins server's actual address.
prometheus.yml
scrape_configs:
Add this new job to your existing configurations
- job_name: 'jenkins'
metrics_path: /prometheus
scrape_interval: 15s
static_configs:- targets: ['your-jenkins-server:8080']
Let's quickly break down what this little chunk of YAML is doing:
job_name: This is a simple, human-friendly label for the metrics coming from this source. You'll see 'jenkins' show up in Prometheus, making it easy to identify your data.metrics_path: This tells Prometheus the specific URL path where our plugin is serving up the metrics. Remember we configured this earlier.scrape_interval: This is how often Prometheus will "scrape" or collect data from Jenkins. A value of 15 seconds is a solid starting point that gives you near-real-time data without putting too much strain on your systems.static_configs: In straightforward setups with a single Jenkins master, this is where you list the address of your server.
Verifying the Connection
Once you've saved the updated prometheus.yml file, you'll need to restart your Prometheus server for the changes to take effect. The next step is critical: you have to verify that the connection actually worked. Don't just assume it's all good—a quick check now will save you from major headaches later when your dashboards are empty.
Head over to your Prometheus UI in a web browser. In the top navigation, click on "Status" and then select "Targets." You should now see a new entry for your 'jenkins' job. If the state is UP and glowing green, you're in business! Prometheus is officially scraping metrics from Jenkins.
If the state is 'DOWN,' it's time to do a little detective work. The most common culprits are usually networking issues (like a firewall getting in the way) or a simple typo in the targets address. Double-check that URL and make sure your Prometheus server can actually reach the Jenkins instance over the network.With the target showing as UP, there's one last sanity check I always like to do. Go to the "Graph" tab in the Prometheus UI and start typing jenkins_ into the expression bar. If everything is working, the autocomplete should pop up with a whole list of available Jenkins metrics.
Try running a simple query like jenkins_job_duration_seconds. Seeing data points appear on the graph is the final confirmation. Your data pipeline is now flowing, all set to be turned into beautiful, insightful visualizations.
Alright, with Jenkins now happily sending its metrics over to Prometheus, it's time for the fun part: visualization. We need to connect Grafana to this data stream so we can turn those raw numbers into a proper Jenkins Grafana dashboard.
This is the step where everything comes together. You’ll point Grafana at your Prometheus instance, and suddenly, you'll have the power to build insightful, living dashboards.
If you don’t have Grafana running yet, their documentation is excellent and covers just about every operating system you can think of. Once you’re logged into the web UI, you’re ready to hook it into the pipeline we've just built. Thankfully, this part is surprisingly simple.
Adding Prometheus as a Data Source
First, head over to the configuration section in the Grafana UI—it's the gear icon on the left-hand menu. From there, select "Data Sources."
You'll see a big "Add data source" button. Give that a click. Grafana can pull data from a ton of different places, but we’re obviously looking for Prometheus.
Once you select Prometheus from the list, you’ll land on a simple configuration screen. The only thing that really matters here is the HTTP URL. This needs to be the address of your Prometheus server.
- URL:
http://your-prometheus-server:9090 - Access: Stick with "Server (default)" for most internal setups.
- Authentication: You can leave this disabled unless you've specifically locked down your Prometheus instance.
Enter the URL, scroll down, and hit the "Save & test" button. If everything is configured correctly, Grafana will give you a little green "Data source is working" confirmation. That’s it! Grafana can now query all those juicy Jenkins metrics from Prometheus.
Why Naming Conventions Matter
Here’s a pro-tip that will save you a world of pain later: get your data source naming conventions right from the start. Instead of just calling it "Prometheus," be specific. Try something like "Prometheus-Jenkins-Prod" or "Prometheus-Local-Dev."
As your monitoring stack grows, you'll inevitably add more Prometheus instances for different apps or environments. When a dashboard breaks, having clear, descriptive names makes it dead simple to figure out which data source is being used. It’s a tiny step that dramatically simplifies troubleshooting down the line.
This might seem trivial now, but it’s a foundational practice for building a monitoring platform that can actually scale without becoming a mess.
There's a reason Grafana is so popular—its design encourages these kinds of best practices. Serving over 25 million users globally, Grafana Labs has been named a Leader in the Gartner Magic Quadrant for Observability Platforms, scoring highest for its 'Completeness of Vision'. Its power in monitoring complex systems is undeniable. You can read more about Grafana's leadership in observability.
Alright, with Prometheus scraping your Jenkins metrics and Grafana ready to go, it's time for the fun part: visualizing all that data. The good news is you don't have to build a dashboard from a completely blank canvas.
Why reinvent the wheel? The Grafana community is an incredible resource, and we can pull in a pre-built, battle-tested dashboard to get up and running in minutes. This trick saves hours of tedious work and gives you a professional-grade setup right from the start. We'll grab a popular community dashboard, and then I’ll walk you through how to actually make it yours—because a template is nice, but a dashboard tailored to your team is a genuinely powerful tool.
Importing a Community Dashboard
We're going to start by importing one of the most popular and comprehensive options out there: the 'Jenkins Performance and Health Overview' dashboard. It's incredibly easy to grab using its unique Grafana ID.
- First, head over to the Dashboards section in your Grafana instance (it's the icon with four squares).
- Click the New button, then choose Import.
- In the "Import via grafana.com" field, just type in the ID 9964 and hit Load.
Grafana will automatically fetch the dashboard template for you. On the next screen, you just need to point it to your Prometheus data source from the dropdown menu. Click Import, and that’s it. You now have a fully functional Jenkins dashboard.
Here's a quick look at what you get straight out of the box.
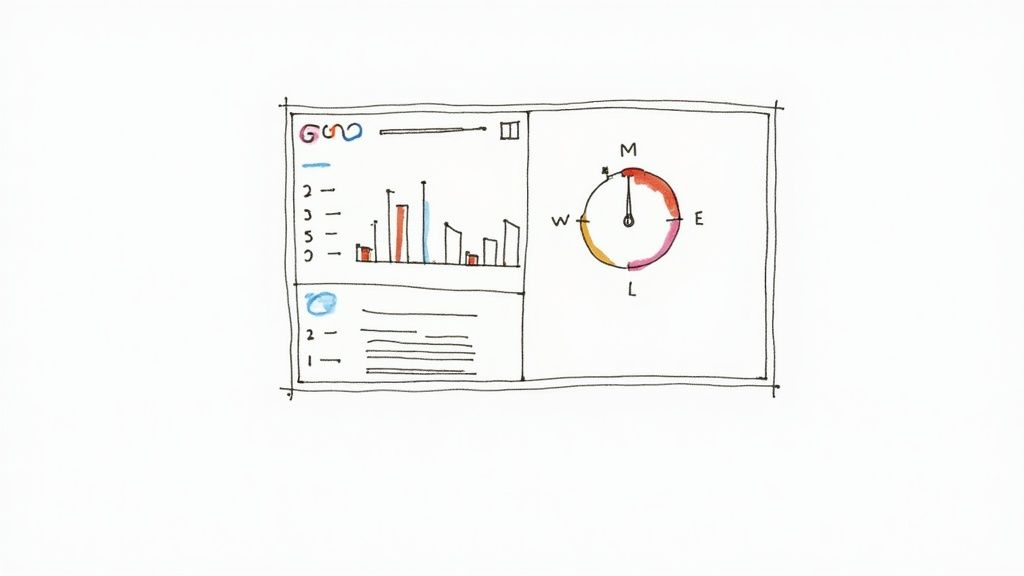
This thing is packed with useful information from day one. You'll see everything from job queue lengths and executor status to deep-dive JVM health metrics, giving you an immediate pulse on your entire Jenkins environment.
The reason I recommend this particular dashboard is its sheer breadth. It tracks all the critical stuff: job queue speeds, executor availability, node health, and even Jenkins's internal resource consumption. It's this level of detail that gives you true visibility into your CI/CD pipeline's health, all powered by the data coming from that Prometheus Jenkins plugin. You can learn more about all its features on the official Jenkins Performance and Health Overview dashboard page.
Customizing Panels and Queries
An imported dashboard is a fantastic starting point, but the real magic happens when you start customizing it. For instance, the default "Builds History" panel is great, but it shows data for all jobs, which can quickly become a noisy mess. Let's make it more useful.
To tweak any panel, just click its title and select Edit. This drops you into the panel editor, where you can see the underlying PromQL query. You might see something generic like sum(rate(jenkins_job_duration_seconds_sum[5m])).
To focus this panel on a single, important job, you can modify the query to include a label filter. It's a simple change that makes a world of difference:
sum by (job) (rate(jenkins_job_duration_seconds_sum{job_name="your-specific-job-name"}[5m]))
With that small tweak, a generic overview panel is transformed into a focused monitor for a mission-critical project.
The real power of a Jenkins Grafana dashboard comes from this iterative process of refinement. Start with a template, identify the metrics that matter most to your team, and then tweak, add, or remove panels until the dashboard perfectly reflects your operational reality.
You aren't just stuck with queries, either. You can change the visualization type completely. Not a fan of a line graph for a particular metric? Switch it to a stat panel, a gauge, or a bar chart. This flexibility is what makes Grafana such an indispensable tool.
If you're looking for more inspiration on what makes a truly great dashboard, check out our other article on the essentials of a useful Jenkins dashboard. By starting with a solid community foundation and tailoring it to your needs, you can build a monitoring tool that drives real improvements in your development pipeline.
Answering Common Jenkins Grafana Questions
Getting your Jenkins Grafana dashboard up and running is a fantastic first step. You've got the data flowing and the graphs are showing something. But now, the real work begins: turning that cool-looking dashboard into an indispensable tool that tells you exactly what's happening in your CI/CD pipeline.
Let's walk through some of the most common questions that pop up right after the initial setup. We'll tackle how to zero in on the metrics that matter, set up alerts so you're the first to know about failures, and solve that classic "why is my panel empty?" problem.
What Are The Most Critical Metrics To Monitor First?
When you first connect the Prometheus plugin, the sheer volume of available metrics can feel like drinking from a firehose. It's easy to get lost. While every team has its own unique priorities, there are a handful of metrics that provide immediate, high-impact value for pretty much any CI/CD setup.
If you're wondering where to begin, build your first dashboard around these essentials:
jenkins_job_duration_seconds: This is your canary in the coal mine. When builds start slowing down, this metric will scream it from the rooftops, letting you catch performance regressions before they grind your delivery cycle to a halt.jenkins_job_queuing_duration_seconds: Are your developers constantly waiting for a build agent to become free? This metric tells you exactly that. If queue times are creeping up, it’s a clear sign you need to scale up your agent capacity.jenkins_node_online_status: A simple but non-negotiable health check. You need to know the second a build agent drops offline, and this metric gives you that instant visibility.jenkins_job_total_count(labeled by result): By filtering this metric forFAILUREversusSUCCESS, you get a powerful, high-level view of your pipeline's overall health and success rate. It's the quickest way to see if things are generally going well or if a recent change has introduced instability.
Starting with these four gives you a solid foundation. You'll have a clear view of job performance, resource constraints, infrastructure health, and overall build outcomes.
How Do I Set Up Alerts For Failed Jenkins Jobs?
A dashboard is great for looking at what happened, but true proactivity comes from alerts that tell you what’s happening right now. Setting up Grafana to ping you the moment a build fails is a straightforward process that can slash your mean time to resolution (MTTR).
First, you'll want to create a new panel in your Grafana dashboard. The magic here is in the PromQL query you use to isolate only the failed jobs. A query like rate(jenkins_job_total_count{result='FAILURE'}[5m]) > 0 is perfect for this. It calculates the per-second rate of jobs marked as FAILURE over the last five minutes and checks if that rate is anything above zero.
With the query in place, head over to the panel's Alert tab. This is where you'll configure the rule itself. Set it to trigger when the value is above 0 and have it evaluate frequently—every minute is a good starting point. The last piece of the puzzle is linking this rule to a notification channel. You can configure these in Grafana's main alerting settings to send notifications to tools like Slack or PagerDuty.
A simple alert like this fundamentally changes your workflow. You move from discovering failures by chance to being notified the instant they happen, which is a cornerstone of maintaining a healthy and reliable CI/CD pipeline.
Why Are My Dashboard Panels Showing "No Data"?
Ah, the dreaded "No Data" message. Seeing this on your brand-new panels is a classic rite of passage, so don't sweat it. It's almost always one of a few common issues that are pretty easy to track down.
Before you go on a deep-dive investigation, check the simple stuff. Look at the time range selector in the top-right corner of your dashboard. It's surprisingly easy to accidentally set a time window where no data was actually collected, especially right after you've set everything up.
If the time range looks right, your next stop is the Prometheus UI itself. Go to the Status > Targets page. Find your 'jenkins' job and check its state. It should be UP. If it's DOWN, you've found your problem: Prometheus can't connect to Jenkins. Double-check your prometheus.yml config for any typos in the scrape URL and make sure no firewall rules are getting in the way.
If the target is up, the final step is to test your query directly in the Prometheus expression browser. Copy and paste your PromQL query there. If it still returns no data, the issue is with the query itself. You might have a typo in a metric name or be using a label that doesn't exist.
Optimizing your CI/CD pipeline is a continuous journey, and having the right tools makes all the difference. Mergify provides deep CI insights and intelligent automation to reduce costs, secure your codebase, and eliminate developer friction. See how our Merge Queue can streamline your workflow.