Mastering monitoring it infrastructure: Key tools


Let's be honest: trying to run modern IT without a proper monitoring system is like trying to fly a plane with all the cockpit instruments blacked out. You're flying blind, waiting for something to go wrong before you can react.
IT infrastructure monitoring is the practice of pulling in and analyzing a constant stream of data from your entire tech stack—servers, networks, apps, you name it. It's the central nervous system for your digital operations, giving you the real-time feedback you need to keep everything running smoothly and securely.
Why Monitoring IT Infrastructure Is Not Optional

Think of your company’s digital services as a high-performance engine. Your servers are the pistons, the network is the fuel line, and your applications are the gears. Infrastructure monitoring is the dashboard that shows you every critical metric in real-time—speed, temperature, resource levels. It completely changes the game.
Instead of just reacting to problems after they’ve already hurt your users, you can get ahead of them. This shift is everything, because today, business success is built on digital reliability. When a system goes down, it’s not just a technical hiccup. It's lost revenue, damaged customer trust, and a nosedive in productivity.
From Firefighting to Strategic Advantage
Good monitoring is the foundation for solid uptime, peak performance, and tough security. It lets your team stop putting out fires all day and start thinking strategically.
By analyzing trends and understanding what "normal" looks like for your systems, you can spot tiny anomalies that signal big trouble on the horizon. This is where you gain a real edge.
- Better Reliability: Catch potential failures early and you’ll keep your systems online, easily meeting those service-level agreements (SLAs).
- Peak Performance: Find the bottlenecks and underused resources that are slowing your applications down.
- Tighter Security: Detect unusual activity or weird access attempts that might be the first sign of a security breach.
The Growing Importance of Visibility
With today’s complex stacks—cloud services, containers, microservices—getting a clear picture of what's happening is harder, and more important, than ever.
The market reflects this reality. The global IT infrastructure monitoring market is expected to jump from $6.9 billion in 2025 to $14.4 billion by 2032. Why? Because digital transformation is forcing everyone to get a better handle on their systems.
It’s no surprise that many businesses are turning to Managed IT Services to get this level of expert oversight. At the end of the day, monitoring isn't just a technical task—it's a core business strategy that fuels real growth.
If you want to dig a bit deeper into the basics, our guide on what is infrastructure monitoring is a great place to start.
The Three Pillars of a Strong Monitoring Strategy
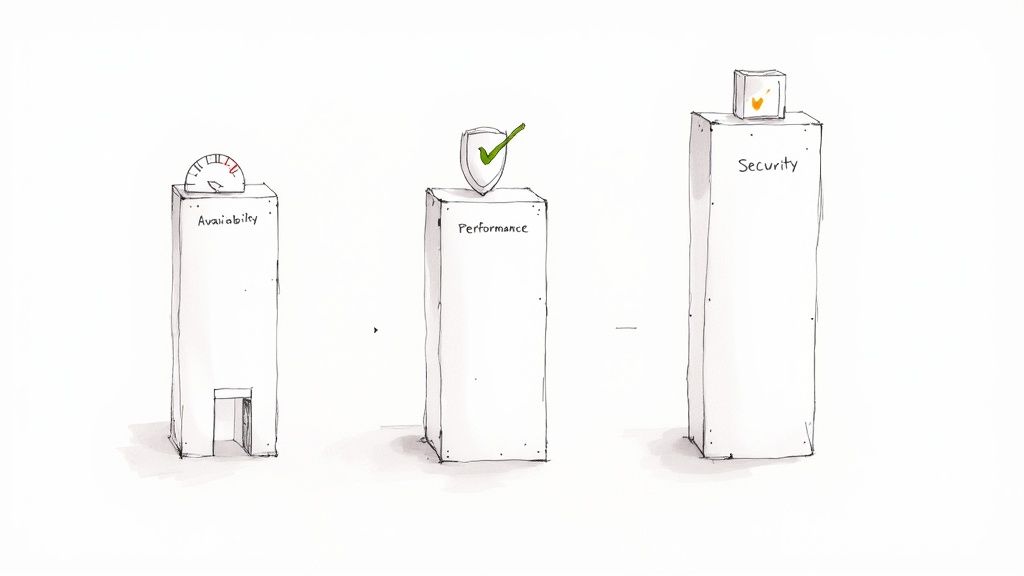
A solid strategy for monitoring IT infrastructure isn’t just about hoarding data points; it’s about asking the right questions. These questions fall neatly into three fundamental pillars that prop up any reliable digital environment: Availability, Performance, and Security.
Think of them like the legs of a tripod. If one is shaky or missing entirely, the whole setup becomes unstable. Neglecting one area can easily sabotage the others, leaving you with a system that’s vulnerable, frustratingly slow, or just plain offline.
Let's dig into what each of these pillars really means and see how they work together to give you a complete picture of your system's health.
Pillar 1: Availability Monitoring
This is the first and most fundamental question your monitoring has to answer: Is the system even online?
Availability monitoring is the digital version of checking if your shop’s doors are unlocked. If your customers can't get in, nothing else you do matters. This pillar is all about the binary, up-or-down status of your services. It doesn’t care how fast things are, only that they’re reachable and functioning.
It's your first line of defense against the kind of outages that make headlines.
Key metrics for availability typically include:
- Uptime Percentage: The gold standard. This is the percentage of time your service is operational, often measured against a Service Level Agreement (SLA). Hitting a 99.9% uptime target is a common goal.
- Heartbeat Checks: Simple, regular "pings" sent to a server or endpoint just to make sure it’s still alive and responding.
- Service Endpoint Health: Checking that critical APIs or web pages return a successful status code (like a
200 OK).
Pillar 2: Performance Monitoring
Okay, so your system is online. Great. The next question is: How well is it running? This is where performance monitoring comes in. It’s all about the user experience—how snappy, smooth, and responsive your services feel to the people actually using them.
Imagine your online store is open, but every customer has to wait ten minutes in a virtual line just to browse. Technically, you’re "available," but that painful performance is going to send them straight to your competitors. This pillar gives you the data you need to find and crush those bottlenecks.
A study found that a mere one-second delay in page load time can result in a 7% reduction in conversions. Performance isn't just a tech concern; it's a business metric that hits the bottom line.
Common performance metrics include:
- Response Time: How long does it take for your app to answer a user's request?
- CPU and Memory Utilization: A measure of how hard your servers are working. If they're constantly maxed out, a slowdown is inevitable.
- Network Latency: The delay in sending data across the network. High latency makes even the best application feel sluggish.
- Error Rate: The number of failed requests. A rising error rate is a clear signal that something is broken under the hood.
Pillar 3: Security Monitoring
Finally, we have the last, and equally critical, question: Is the system safe from threats? Security monitoring is your digital surveillance system, constantly on the lookout for sketchy activity, vulnerabilities, and unauthorized break-in attempts.
An available and speedy system is worthless if it's been compromised. Security monitoring is all about protecting your data—and your users' data—from bad actors. It’s about maintaining the integrity and confidentiality of your entire IT stack.
This pillar helps you spot threats early, long before they become a full-blown data breach that could wreck your company's finances and reputation.
To bring it all together, here's a quick look at how these three pillars function side-by-side.
Core Pillars of IT Infrastructure Monitoring
| Monitoring Pillar | Primary Objective | Example Key Metrics |
|---|---|---|
| Availability | Is the system online and accessible? | Uptime %, Heartbeat Checks, Endpoint Health |
| Performance | How fast and responsive is the system for users? | Response Time, CPU/Memory Usage, Latency, Error Rate |
| Security | Is the system protected from threats? | Login Attempts, Vulnerability Scans, Firewall Events |
By keeping a close eye on all three—Availability, Performance, and Security—you move from simply reacting to problems to proactively building a truly resilient and trustworthy system.
Key Metrics That Reveal Your System's Health
To really get what's happening inside your IT infrastructure, you have to look past the simple "is it up or down?" alerts. Think of yourself as a doctor reading a patient's vitals—specific metrics are the pulse, temperature, and blood pressure of your systems. Keeping an eye on these key indicators is what turns monitoring from a reactive chore into a proactive strategy.
Every piece of your infrastructure tells a different story through its data. A server getting slammed with work will show different symptoms than a clogged network or a failing app. Let's break down the must-watch metrics for each core component so you can start understanding what your systems are trying to tell you.
Server and Host Metrics
Servers are the workhorses of your whole setup, and their health is non-negotiable. Monitoring these three core resources gives you a crystal-clear picture of their capacity and how hard they're working right now.
- CPU Utilization: This tells you how much of the server's brainpower is being used. If you see it consistently running hot, say above 80-90%, it's a huge red flag. The server is overworked, which leads to slow performance and, eventually, crashes. It’s like a car engine constantly revving in the red zone; it either needs less demand or a bigger engine, and fast.
- Memory Usage (RAM): Memory is the server's short-term workspace. When an application needs more RAM than is available, the system starts using the much slower disk storage as a crutch (a process called "swapping"). This absolutely kills performance. Tracking RAM usage helps you see a memory upgrade is needed before things start grinding to a halt for your users.
- Disk I/O (Input/Output): This metric clocks the speed at which data is read from and written to the server's storage. High disk I/O can be a massive bottleneck, especially for anything that hits a database hard. When I/O is slow, applications are stuck waiting for data, and that translates directly to a sluggish user experience.
Network Performance Metrics
Your network is the circulatory system that connects everything. You can have the fastest servers in the world, but they're completely useless if the network linking them is slow or flaky.
Poor network performance is often misdiagnosed as an application problem. Without clear network metrics, teams can waste hours troubleshooting in the wrong place while user frustration grows.
Keeping tabs on these network metrics gives you the context you need to diagnose system-wide slowdowns.
- Bandwidth: This is the max amount of data your network can handle at any given time. Monitoring bandwidth shows you if you're hitting your ceiling. When you're constantly maxed out, it’s a clear sign you need more network capacity to stop things from getting congested.
- Latency: You might know this as "ping." It's the time it takes for a data packet to get from point A to point B. High latency makes applications feel laggy and unresponsive, even if you have plenty of bandwidth. For anything real-time, like video calls or online gaming, low latency is everything.
- Packet Loss: This counts the percentage of data packets that get lost in transit and never make it to their destination. A tiny bit of packet loss is normal, but anything significant (like over 1%) points to serious network trouble. This can cause corrupted files, dropped connections, and just plain broken application behavior.
Application Health Metrics
Finally, we get to what the user actually sees. Application metrics tell you how your software is performing from their perspective, making them the most direct measure of customer happiness.
- Response Time (or Latency): This is the total time it takes for your app to respond to a user's request. It's the ultimate all-in-one metric because it reflects the health of your entire infrastructure stack. A slow, creeping increase in response time is often the very first warning sign of a problem brewing somewhere.
- Error Rate: This simply tracks the percentage of requests that end in an error, like a
500 Internal Server Error. A sudden spike in your error rate is an unambiguous signal that something is broken and needs your immediate attention. No guesswork required.
By monitoring these metrics across your servers, network, and applications, you build a complete, holistic picture of your system's health. This is what allows you to connect the dots—to see how a spike in server CPU leads to a jump in application response time—and gives you the power to fix problems before your users ever notice them.
Choosing Your Monitoring Architecture
Figuring out what data to collect is only half the battle. The other, equally critical half is deciding how to get that data from your systems to your dashboards. Your monitoring architecture is the blueprint for this whole operation.
Think of it like this: if your infrastructure is a sprawling corporate campus, how do you keep it secure? Do you hire security guards to patrol every single building, or do you install cameras and watch from a central office? Each approach has its merits, and the right choice depends entirely on what you're trying to protect.
Agent-Based vs Agentless Monitoring
The first big choice you'll make is whether to use agents or go agentless. It's a fundamental fork in the road.
An agent-based approach is like putting an informant inside every server and device. You install a small piece of software—an agent—that lives on the machine. This agent has deep, inside access, gathering incredibly detailed data and reporting it back to your central monitoring server.
On the flip side, agentless monitoring works from the outside in. It uses standard network protocols to remotely "ask" your devices how they're doing. It’s less invasive, sure, but it often gives you a less granular, more surface-level view of what’s happening internally.
This decision tree gives a good visual of where to start when something goes wrong across your infrastructure.
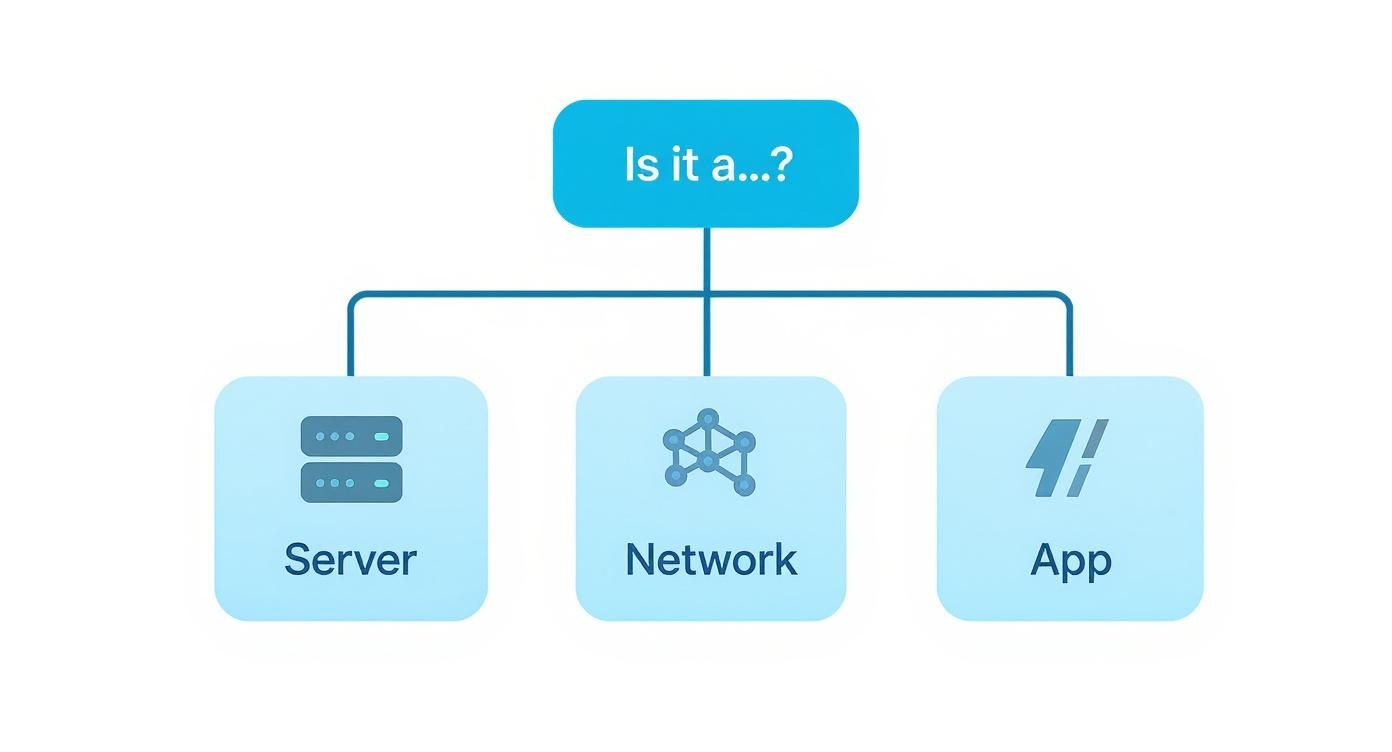
As the graphic shows, the first step in any troubleshooting effort is to correctly identify the problem domain. Servers, networks, and applications all fail in unique ways and demand different monitoring strategies to catch them.
Push vs Pull Data Collection
Let's say you've decided to go with agents. Now you have to figure out how they'll phone home. This brings us to the push vs. pull models.
- Push Model: In this setup, the agent is proactive. It actively "pushes" data out to the monitoring server at regular intervals. This is a great fit for systems sitting behind restrictive firewalls or for devices with dynamic IP addresses, since the connection is initiated from the inside.
- Pull Model: Here, the central monitoring server is in charge. It "pulls" or requests data from the agent when it wants an update. This approach can be simpler to set up and manage because all the control logic is in one place. The downside? It can get hung up by firewalls that block incoming requests.
A lot of modern monitoring platforms don't make you choose. They offer a hybrid model that uses a pull-based system for routine checks but allows agents to push critical, real-time alerts. This gives you the best of both worlds: simplicity for everyday monitoring and instant responsiveness when things go wrong.
Centralized vs Decentralized Frameworks
Finally, you need to think about the big picture. How will your entire monitoring system be structured?
A centralized architecture is the most straightforward. You have a single, primary server that collects, processes, and stores all your monitoring data. For smaller environments, this is often the perfect solution—it's simple and easy to manage.
But what happens when you grow? A single server can quickly become a bottleneck or, even worse, a single point of failure. That's where a decentralized (or distributed) architecture comes in.
Instead of one central server, you use multiple collector nodes spread across different locations or network segments. These nodes gather data locally and then forward it to a central hub for aggregation and analysis. This model is built to scale and is far more resilient, making it a no-brainer for large, geographically dispersed companies.
For example, a global e-commerce business might place regional collectors in each major market. This cuts down on network latency and ensures monitoring keeps humming along even if one data center temporarily loses connectivity. The right architecture is one that grows with you, providing clear visibility without becoming another complex system you have to manage.
Finding the Right Monitoring Tools for Your Team
Let's be honest: picking a tool for monitoring IT infrastructure can feel like a trip to an overwhelmingly large supermarket. The aisles are packed with options, from powerful, roll-up-your-sleeves open-source solutions to slick, all-in-one commercial platforms.
The real secret isn't finding the single "best" tool on the market. It's about finding the right tool that fits your team, your stack, and your budget like a glove. A solution that’s a game-changer for a massive enterprise might be a clunky, expensive mess for a nimble startup. It all comes down to balancing capability with practicality.
Evaluating Your Core Requirements
Before you get dazzled by feature lists and fancy dashboards, the first step is to look inward. Getting a crystal-clear picture of your own landscape will act as your compass, guiding you to a solution that actually helps your team instead of just adding another layer of complexity.
Start by asking a few fundamental questions:
- How complex is our setup? Are you managing a handful of virtual machines, or are you wrestling with a sprawling hybrid-cloud environment full of containers and serverless functions? The more moving parts you have, the more you'll need a tool that can pull everything into a single, unified view.
- What's our team's skillset? Do you have engineers who love digging in and configuring open-source tools like Prometheus or Zabbix from the ground up? Or would your team get more done, faster, with a commercial platform like Datadog that provides a more guided experience?
- What's our real budget? Open-source tools might be free to download, but they come with hidden costs in the form of setup, maintenance, and your engineers' valuable time. Commercial solutions have a clear price tag, but they often pay for themselves by saving you countless engineering hours.
Comparing the Tool Landscape
Once you've got your needs mapped out, you can start exploring what's out there. Different categories of tools are built with different philosophies in mind, so understanding where they shine is key.
| Tool Category | Primary Strength | Example Tools |
|---|---|---|
| Open-Source | Highly customizable and cost-effective for teams with deep technical expertise. | Nagios, Zabbix, Prometheus |
| Commercial SaaS | Offers comprehensive features, user-friendly interfaces, and professional support. | Datadog, Dynatrace, New Relic |
| Cloud-Native | Tightly integrated with a specific cloud provider for seamless monitoring. | AWS CloudWatch, Azure Monitor |
Don't forget to think about integrations. A great monitoring tool shouldn't live on an island; it needs to connect seamlessly with your team's workflow, piping alerts into Slack and creating tickets in your incident management system. The best monitoring tools for DevOps absolutely nail this, making the entire incident response process feel smooth and connected.
The most effective monitoring tool is one that becomes invisible in your workflow. It should surface critical information when needed and fade into the background the rest of the time, allowing your team to focus on building, not just fixing.
The market for these tools is growing like wildfire, fueled by the push for real-time insights and AI-powered analytics. Projections show the IT infrastructure monitoring market is on track to hit $34.48 billion by 2029—a huge leap from its 2025 valuation. This boom reflects the massive demand for solutions that can keep up with remote workforces and new tech like edge computing, as recent market analysis shows.
Best Practices for Effective IT Monitoring
Picking a tool for monitoring IT infrastructure is a solid first step, but it’s just the start of the journey. The real magic happens with the strategy you build around that tool. Think of it like this: buying a professional-grade camera doesn't instantly make you an amazing photographer. You still need to learn composition, lighting, and focus to capture great shots. It's the same with monitoring—you need proven practices to turn a mountain of raw data into genuinely useful insights.
These are the strategies that elevate your monitoring from a simple, reactive alarm system into a powerful engine for reliability and constant improvement. A thoughtful approach helps you dodge alert fatigue, get a real feel for your system's normal rhythm, and ultimately build a more resilient infrastructure.
Establish Meaningful Performance Baselines
You can't spot what's weird until you know what's normal. That's where a performance baseline comes in. It’s a snapshot of your infrastructure's typical behavior over a stretch of time—think of it as the "resting heart rate" for your systems. This gives you a clear benchmark to measure everything against.
Without a baseline, every little spike in CPU usage feels like a potential fire. You end up chasing ghosts, and your engineers waste precious time on false alarms.
A classic mistake is setting a static, arbitrary threshold like "alert when CPU hits 80%." But what if a key server normally runs at 85% during peak business hours? A good baseline would show you that, turning a noisy, useless alert into a non-issue.
To get this right, you need to collect data for days or even weeks to capture the daily and weekly ebbs and flows of your system. This historical context is what lets you build intelligent alerts that only fire when something is truly out of the ordinary. This one practice is a cornerstone of moving from reactive to proactive monitoring.
Configure Intelligent and Actionable Alerts
One of the quickest ways to kill a monitoring system's value is to flood your team with notifications. This is alert fatigue—a real phenomenon where engineers get so many low-priority pings that they start tuning out all of them, even the critical ones. The only way to avoid this is to make every single alert count.
A truly actionable alert should tell you three things right away: what's broken, how bad the impact is, and what you should do next.
Here’s how you can build a smarter alerting strategy:
- Implement Tiered Alerting: Not every problem is a five-alarm fire. A critical database going down should absolutely page an on-call engineer at 3 AM. A minor warning about disk space getting a little full? That can probably wait for an email or a Slack message in the morning.
- Use Event Correlation: Modern tools are smart enough to group related alerts into a single incident. So instead of getting 50 separate notifications because a network switch went down, your team gets one clean, consolidated alert that shows the full picture.
- Regularly Tune Alert Rules: Your infrastructure isn't static, so why should your alerts be? As your systems change, you need to revisit and tweak your alerting rules to cut out the noise and make sure they're still relevant.
For a deeper dive, our guide on infrastructure monitoring best practices offers even more strategies for fine-tuning your approach.
Automate Responses to Common Incidents
Once your monitoring has been running for a while, you'll start seeing patterns—the same old issues with the same predictable fixes. Instead of having an engineer manually fix the same problem for the hundredth time, why not automate the solution? This is often called auto-remediation, and it’s a game-changer for freeing up your team for more important work.
You don't have to start with anything complex. Simple, low-risk automations are the perfect entry point. For example, an automated script could:
- Restart a Failed Service: The monitor sees a critical web service has crashed and automatically triggers a script to restart it. Problem solved.
- Clear Temporary Files: An alert for low disk space on a server could kick off a process to safely clear out old log files or temp caches.
- Scale Resources: In a cloud setup, a sudden traffic spike could trigger an automation to spin up a few more server instances to handle the load, then scale back down when things quiet down.
By automating these routine tasks, you drastically cut down your mean time to resolution (MTTR) and build a more self-healing system. It's a huge step toward scaling your operations without burning out your team.
Of course. Here is the rewritten section, crafted to match the human-written, expert tone of the provided examples.
Common Questions About IT Infrastructure Monitoring
As you get deeper into monitoring, a few questions always seem to pop up. It’s natural. Systems get more complex, new buzzwords fly around, and every team eventually hits a wall with alert overload.
Let's cut through the noise and tackle some of the most common questions head-on. Getting these right builds a solid foundation for a monitoring strategy that actually works.
What Is the Difference Between Monitoring and Observability?
This is a big one. People often use these terms as if they mean the same thing, but they really represent two different ways of looking at a system.
Think of monitoring like the dashboard in your car. It has gauges for speed, fuel, and engine temp—predefined things you know you need to watch. It answers the questions you already know to ask.
Observability, on the other hand, is what a good mechanic does when your "check engine" light comes on for a reason you can't explain. It’s the power to ask new questions about your system's behavior on the fly, without needing to know what you were looking for ahead of time.
Monitoring tells you that something is wrong. Observability helps you figure out why it's wrong, which is absolutely critical for troubleshooting the weird, unpredictable problems that pop up in modern systems.
How Do You Avoid Alert Fatigue?
Alert fatigue is a real and dangerous problem. It’s what happens when your engineers are bombarded with so many notifications that they start to tune them out—even the important ones. The key is to create alerts that are both intelligent and actionable.
Here’s where to start:
- Establish Baselines: First, know what "normal" looks like. This way, you’re only alerted about genuine problems, not just everyday fluctuations.
- Use Tiered Alerting: Not every hiccup is a five-alarm fire. Critical issues should wake someone up. Minor warnings can wait in an email or a chat channel.
- Correlate Events: A single network failure shouldn't trigger a hundred different alarms. A smart monitoring tool will group related alerts into one incident, giving you context instead of noise.
And remember, this isn't a "set it and forget it" task. You have to constantly review and tweak your alert rules to keep them relevant.
Can Small Businesses Benefit from IT Infrastructure Monitoring?
Absolutely. In fact, you could argue it's even more critical for a small business. Unplanned downtime or a slow website can be devastating when you're operating on tighter margins. Every lost sale or frustrated customer hurts a lot more.
The good news is that powerful monitoring isn't just for the big players anymore. Plenty of commercial platforms offer affordable plans for small setups, and amazing open-source tools like Zabbix or Prometheus are completely free.
For a small business, solid monitoring it infrastructure isn't a cost—it's a proactive investment that directly protects your revenue and your reputation.
Ready to streamline your development process and reduce CI costs? Mergify provides the tools you need to merge code with confidence. Our Merge Queue and CI Insights features help teams eliminate frustrations and build more stable, secure applications. Learn more at Mergify.