Unit Test Results: From Noise to Insight


Unit test results are way more than a simple pass/fail message. They're diagnostic signals, telling a detailed story about the health of your code. Think of them as a series of mini-checkups for your software, where each green light confirms a tiny component is working exactly as it should. With every successful run, your confidence grows.
What Unit Test Results Really Tell You

At first glance, "pass" or "fail" seems almost too simple. But don't let that fool you—these results are the foundational language of reliable software. Every single test outcome is a piece of evidence, either confirming or denying that a specific bit of code behaves as you expect it to under a certain set of conditions.
It’s a bit like a doctor testing a patient's reflexes. A good knee-jerk reflex doesn't mean the patient is perfectly healthy, but it absolutely verifies that one specific neural pathway is functioning correctly. In the same way, a passing unit test confirms that a single function—like calculating a discount or validating an email format—works perfectly in isolation.
The Immediate Feedback Loop
One of the most powerful things about unit testing is the sheer speed of the feedback. Developers can rip through hundreds of these tests in seconds, right on their local machines. This creates an incredibly tight feedback loop, letting them spot errors and logical flaws almost the moment they’re written.
This instant validation has a huge impact on both productivity and code quality. Instead of a simple bug lurking for hours or days only to be found during manual QA, it’s caught and fixed in minutes. This is how you stop small mistakes from snowballing into those complex, nightmare-to-diagnose problems down the line.
A solid unit test suite isn't just about finding bugs; it’s about enabling developers to code with confidence. It flips the script from a process of cautious uncertainty to one of bold, rapid iteration.
Building a Safety Net for Change
Well-written unit tests become a critical safety net. They give your team the freedom to refactor old code, bolt on new features, or upgrade libraries without constantly looking over their shoulder, terrified of breaking something else. If a change introduces an unexpected side effect, a failing unit test immediately sounds the alarm.
This safety net is absolutely essential for keeping up momentum and agility. It empowers developers to continuously improve the codebase, knowing their automated checks have their back and will protect them from regressions. The collection of unit test results over time becomes a living document, a testament to your application's stability.
Ultimately, getting fluent in the language of these results is a non-negotiable skill. It allows teams to:
- Innovate Fearlessly: Refactor and improve code with a reliable safety net in place.
- Increase Velocity: Catch bugs early, cutting down the time sunk into complex debugging later.
- Boost Confidence: Ship high-quality, dependable code, certain that the core components have been verified.
Decoding the Numbers Beyond Pass or Fail
A simple "pass" or "fail" gives you an instant verdict, but the real story of your code's health is written in the numbers just beneath the surface. True insight comes from understanding not just the outcome, but the context around it. Treating unit test results as a binary choice is like looking at a map and only seeing land or water—you miss all the crucial details about the terrain.
These deeper metrics are essential diagnostic tools. This is reflected across the industry, where software quality assurance has become a massive focus. The global software testing market is projected to hit around $97.3 billion by 2032, with many large organizations dedicating over 25% of their IT budgets to testing. That kind of investment makes it clear we need to squeeze every bit of value from each test run.
The Meaning Behind Pass, Fail, and Skipped
A passing test feels good, but what does it actually confirm? A pass validates that one specific piece of code behaves exactly as expected under a very specific, controlled scenario. It’s a thumbs-up for a known-good path.
On the other hand, a fail is an immediate red flag, but it doesn't always mean the production code is broken. A failure could point to a few different things:
- A genuine bug in the code unit being tested.
- A flawed test with incorrect logic or assertions.
- A requirements mismatch where the test reflects outdated business rules.
Then there's the often-overlooked skipped test. This means a test was intentionally bypassed by the test runner. While sometimes necessary, a growing pile of skipped tests can be a warning sign of accumulating technical debt or environmental issues that are stopping tests from running reliably.
Demystifying Code Coverage Metrics
Code coverage is probably the most talked about—and misunderstood—metric in unit testing. Think of it like mapping a new territory. Your coverage report shows you which roads (lines of code) your tests have driven down, but it tells you nothing about the quality of that drive. A high percentage doesn't automatically mean your code is bug-free.
Code coverage is a powerful tool for finding what you haven't tested, not for proving what you have tested is correct. Its primary value is in revealing blind spots in your test suite.
Different types of coverage give you different levels of insight:
- Line Coverage: The simplest metric. It just measures the percentage of executable lines of code that were run by your tests.
- Branch Coverage: A more telling metric. It checks if your tests have exercised both the
trueandfalseoutcomes of everyifstatement or other conditional branch. - Function Coverage: This one measures how many of the functions or methods in your code have been called by at least one test.
Getting a handle on these different metrics is a key part of seeing the full picture of your unit test results. You can explore more about essential software development metrics in our detailed guide.
Using Coverage as a Diagnostic Tool
Instead of chasing a vanity metric like 100% coverage, use these numbers as a guide. If you see coverage drop after a pull request, that’s a dead giveaway that new logic was added without corresponding tests. This is the perfect moment to dig in before that code gets merged.
The table below breaks down these core metrics and how they're commonly misinterpreted.
Key Unit Test Result Metrics Explained
Here’s a quick summary of the essential metrics you'll find in unit test reports and what they really tell you about your code's health.
| Metric | What It Measures | Common Misconception |
|---|---|---|
| Pass/Fail Ratio | The proportion of tests that succeed versus those that fail. | A 100% pass rate means the code is perfect and bug-free. |
| Line Coverage | The percentage of executable lines of code visited by tests. | High line coverage guarantees that all logic has been properly tested. |
| Branch Coverage | The percentage of conditional branches (if/else) tested. | Assumes that covering a branch means all edge cases for it are handled. |
| Execution Time | The total time taken for the test suite to complete. | Faster is always better, even if it means less thorough tests. |
Ultimately, these metrics aren't a final grade but a starting point for a deeper conversation. They provide the quantitative data you need to ask qualitative questions, like, "Why isn't this critical path covered?" or "What caused this sudden spike in test failures?" This analytical approach is how you turn raw numbers into real engineering improvements.
Turning Failed Tests Into Productive Fixes
Seeing a unit test fail shouldn't be a dead end; it's a roadmap. Think of it as an instant, detailed bug report generated the very moment a flaw sneaks into the codebase. Instead of a moment of frustration, a red build should kick off a clear, systematic process that turns that problem into a high-quality fix.
This whole approach flips the script. Analyzing unit test results stops being a chore and becomes a genuinely productive, value-adding part of your workflow.
The first instinct is always to jump in and start changing code. Resist it. A failed test is giving you crucial data, and your first job is to play detective. Take a moment to actually read the failure message and the stack trace. A well-written test will tell you exactly what went wrong, something like, "Expected user to be active, but was inactive." That message is your first and most important clue.
This visualization breaks down the typical flow, guiding developers from the initial test outcome to the final, decisive action.
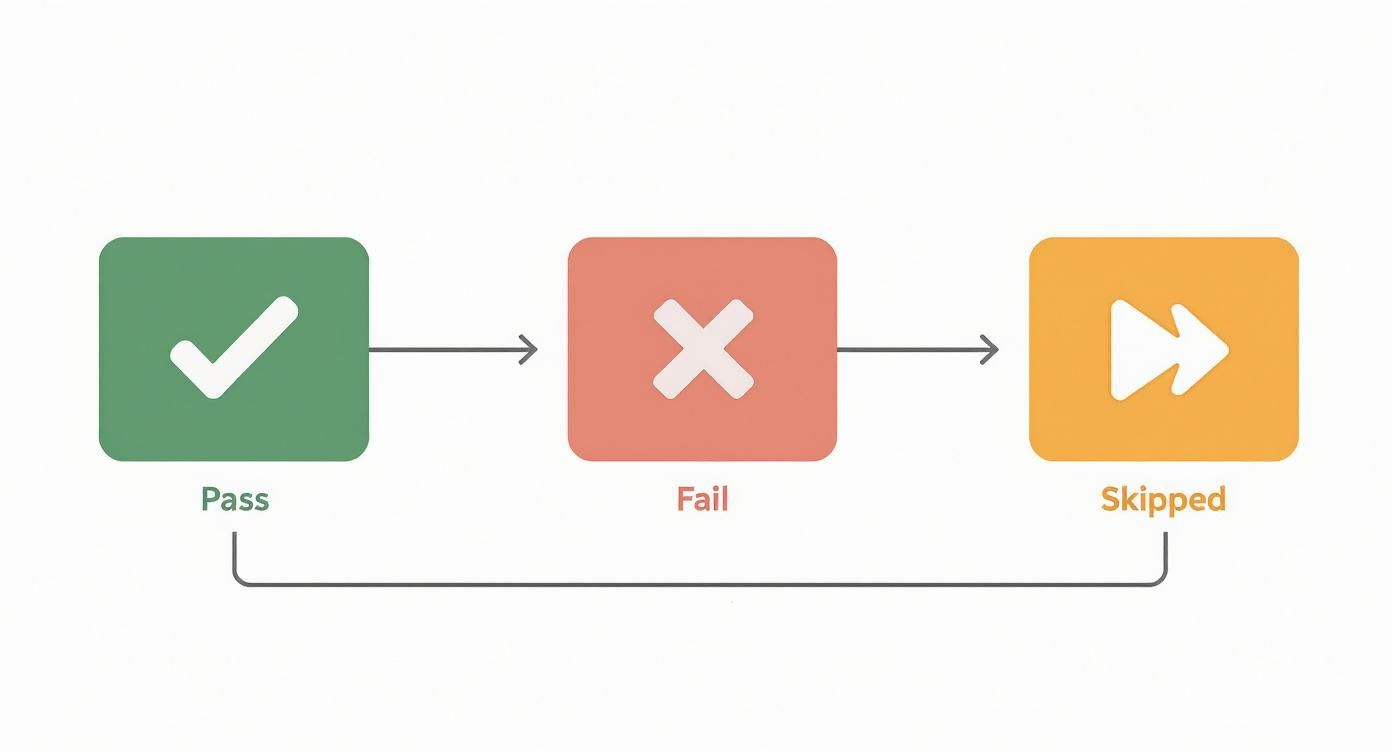
As the flow shows, "pass" is what we're all aiming for. But both "fail" and "skipped" results demand a closer look to keep your code healthy and reliable.
Diagnosing the Common Suspects
Once the error message gives you the "what," the stack trace will show you the "where." It points to the exact line of code where the test's assertion fell flat. With that info in hand, you can start running through the usual suspects behind most test failures.
More often than not, the culprit is one of these:
- Logic Errors: This is the most common reason—the production code simply has a bug. The test did its job perfectly and caught a scenario where the code isn't behaving as expected.
- Flawed Assertions: Sometimes, the test itself is the problem. The production code might be working just fine, but the test is asserting the wrong outcome. This is actually a great chance to go back and clarify the requirements.
- Test Data Issues: The setup data for the test might be incomplete or just plain wrong. This can trigger a failure that has nothing to do with the code's actual logic.
- Environment and Dependency Problems: A test might fail because of a poorly configured mock or a missing dependency, not a bug in your code. This is super common in tests that aren't fully isolated from their surroundings.
A failed test is a conversation starter. It forces you to re-examine your assumptions about how a piece of code is supposed to behave, leading to a deeper understanding for the entire team.
From Diagnosis to Resolution
After you've pinpointed the likely cause, the next move is to reproduce the failure consistently. Can you run that single test and watch it fail every single time? This confirms you aren't dealing with a "flaky" test—those notoriously difficult issues where a test passes and fails randomly without any code changes.
Let's walk through a classic example. Imagine a test fails with the message: AssertionError: Expected 90, but got 100. The test was for a function that's supposed to apply a 10% discount to a $100 item.
- Read the Message: Okay, the function is returning the original price, not the discounted one. Simple enough.
- Examine the Code: You glance at the
applyDiscountfunction and spot the calculation:price - (price / discount). Ah, there's the bug. It's a simple logic error; it should beprice - (price * discount). - Write the Fix: You correct the formula in the production code.
- Rerun the Test: You run just the one failing test again. Boom, it passes.
- Rerun All Tests: The final, crucial step. You run the entire test suite to make sure your fix didn't accidentally break something else downstream.
This debug-and-fix cycle is the very heart of test-driven development. By treating failed unit test results as precise, actionable instructions, you build a reliable process for improving code quality, one small fix at a time. It ensures that every failure leads directly to a more robust and predictable codebase.
Writing Tests That Produce Trustworthy Results
The quality of your unit test results is a direct reflection of the quality of your tests. It's that simple. If your tests are flaky, poorly designed, or incomplete, the results they spit out—whether green or red—are basically just noise.
To get a signal you can actually trust, you need to build a test suite that acts as a stable, dependable safety net. This means moving beyond just writing tests that pass and focusing on crafting tests that are robust, isolated, and intentional. The goal is to make every "pass" a genuine moment of confidence and every "fail" a clear sign of a real, actionable problem.
This isn't just a "nice-to-have" anymore. As of 2025, about 46% of software teams report that automation has taken over 50% or more of their manual testing. With that much reliance on automated checks, making sure each test is rock-solid isn't just a best practice—it's a necessity.
Adopting the FIRST Principles for Reliability
So, how do you build this foundation of trust? Many successful teams lean on the FIRST principles of unit testing. It's a simple acronym but a powerful framework for making sure your tests generate meaningful results every single time.
Here's what it stands for:
- Fast: Tests need to run quickly. Slow tests get in the way of the development flow, and developers will just stop running them. That defeats the whole purpose of a rapid feedback loop.
- Independent: Each test has to stand on its own. It should run in any order without needing or messing with other tests. This stops one bad test from causing a whole cascade of failures.
- Repeatable: A test must give you the exact same result every time, no matter where it runs—your local machine, the CI server, anywhere. Consistency is everything if you want to trust the outcome.
- Self-Validating: The test should have a clear, binary outcome: pass or fail. No one should have to dig through log files or console outputs to figure out what happened.
- Timely: Tests should be written "just in time"—ideally, right before the production code they're supposed to validate. This is a core idea in Test-Driven Development (TDD) and it forces you to write code that's testable from the get-go.
Applying these principles consistently will dramatically improve the quality of your unit test results. For a deeper dive, you can also check out our comprehensive guide on unit testing best practices.
Flaky tests are the silent killers of a test suite's credibility. If developers can't trust the results, they will start ignoring them, and the entire safety net collapses.
Eliminating Flaky Tests for Good
One of the biggest threats to trustworthy results is the dreaded "flaky" test—one that passes sometimes and fails others without any code changes. They're incredibly frustrating and can destroy a team's confidence faster than anything else.
Flakiness usually comes from poorly managed dependencies or asynchronous operations. The usual suspects include:
- Race Conditions: Tests that rely on the timing of async operations can fail if one process unexpectedly finishes before another.
- Order Dependency: A test might only pass if it runs after another specific test that sets up some required state, which violates the "Independent" principle.
- External Dependencies: Tests that make real network calls or hit a shared database are at the mercy of factors outside their control, leading to inconsistent results.
To hunt down and fix these problems, start by isolating the flaky test. Try running it in a loop—maybe 100 times—to reliably trigger the failure. Once you can make it fail consistently, you can diagnose the root cause. Often, the fix involves adding proper waits for async code or using mocks and stubs to cut the test off from external services.
For teams serious about building tests that provide trustworthy results, this is often the specialized work of a dedicated Software Engineer in Test. Systematically getting rid of flakiness restores faith in your test suite and makes every result a signal worth paying attention to.
Automating Test Analysis in Your CI/CD Workflow
Running tests on your local machine is a great start, but the real magic happens when unit testing becomes an automated gatekeeper for your entire team. It's the difference between a personal safety net and a team-wide quality enforcement system. This is where Continuous Integration/Continuous Deployment (CI/CD) pipelines come in.
By plugging your unit test results into a CI/CD workflow with tools like GitHub Actions or GitLab CI, you create a powerful defense. Every time a developer pushes code, an army of automated checks runs in a clean, consistent environment. The goal? To make sure nothing broken ever slips into the main codebase.
Establishing Automated Quality Gates
A CI pipeline is more than just a place to run tests—it’s where you enforce your standards. By setting up automated "quality gates," you can programmatically block any code that doesn't meet the team's quality bar. This shifts the burden of catching basic issues from a human reviewer to an impartial, automated process.
Think of these gates as checkpoints that every pull request must pass before it can even be considered for merging. Common quality gates include:
- No Failing Tests: This one is non-negotiable. If a single unit test fails, the pipeline stops, and the merge is blocked. It's the most critical gate of all.
- Coverage Thresholds: You can set a rule that fails the pipeline if a code change drops your overall test coverage below a certain percentage, like 80%.
- Preventing Coverage Drops: A smarter approach is to block any change that reduces coverage, even if the total is still above your threshold. This simple rule ensures all new code is properly tested.
Automating these checks is how you stop regressions before they start and maintain a high bar for quality across the board. This kind of systematic approach is central to effective development, as outlined in this playbook for mastering continuous integration strategies.
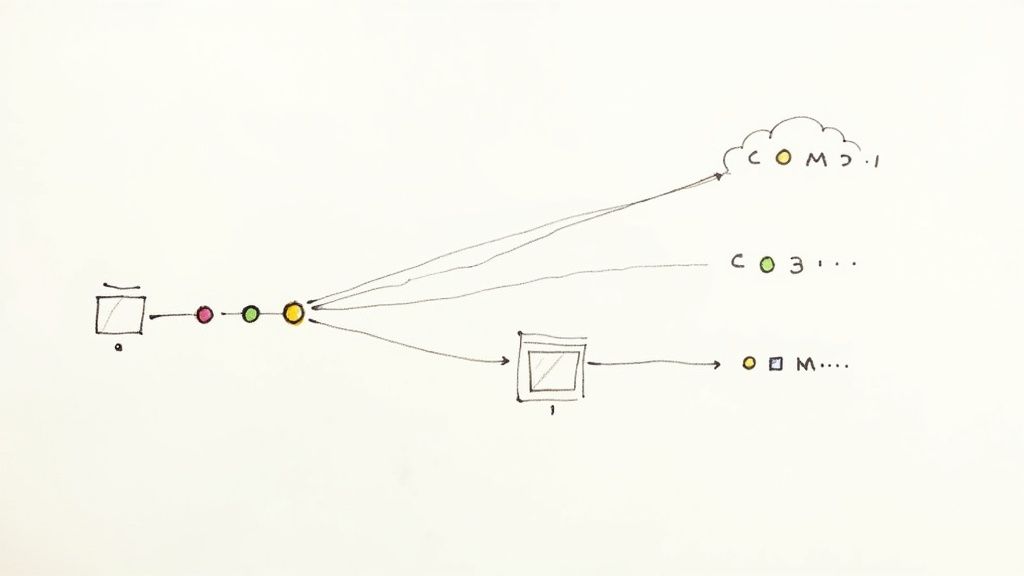
Bringing CI Insights Directly into Pull Requests
It wasn't long ago that getting CI feedback was a real chore. A developer would push code, see a dreaded red 'X' next to their commit, and then have to dig through logs in a separate tool just to figure out what went wrong. Thankfully, modern tools have completely flipped this script by bringing rich, actionable insights directly into the pull request interface—right where developers live.
This is a massive workflow improvement. Instead of just being a pass/fail signal, the CI pipeline becomes an intelligent partner that gives you immediate, contextual feedback. Developers can see not just that a test failed, but which one, why it failed, and how performance changed, all without ever leaving their PR.
A modern CI pipeline does more than just run tests. It surfaces trends, identifies flaky behavior, and provides observability into your test suite's health, turning raw test output into strategic engineering intelligence.
Mergify CI Insights, for example, presents a clear, visual summary of test performance right inside the pull request.
The dashboard instantly shows new test failures and performance regressions, giving developers exactly what they need to fix issues fast.
Identifying Flaky Tests and Performance Trends
One of the most powerful features of integrated CI analysis is its ability to spot patterns over time. A single test failure is just a data point. But a test that fails 10% of the time? That's a systemic problem. Advanced CI tools can automatically detect these "flaky" tests—the ones that pass and fail intermittently and slowly erode everyone's trust in the test suite.
By flagging these unreliable tests, teams can finally prioritize fixing them and restore confidence in their automated checks. These tools also track test execution times, alerting you when a specific test or the whole suite starts to drag. This helps you proactively manage performance and keep your feedback loop tight.
To really level up, you can integrate advanced automated testing strategies into your workflow. This transforms your pipeline from a system that just reacts to bugs into one that proactively improves how you build software.
Using Test Data to Drive Strategic Decisions
Look, a good development team reacts when a test fails. A great one looks for the story the data is telling over time.
Analyzing aggregated unit test results is how you graduate from tactical fixes to strategic improvements. It’s the difference between stamping out a single fire on a pull request and seeing the patterns that emerge across hundreds of builds, revealing where the real problems are.
This is where your test suite stops being just a bug-catcher and starts acting like a source of powerful engineering intelligence. When you collect and visualize this data, you can spot subtle but critical trends long before they blow up into major incidents.
Spotting Patterns in Your Test Data
Once you start aggregating test results, you can ask bigger, more important questions. Is one specific part of the codebase causing a ridiculous number of failures? Are our tests getting slower every single month? Is coverage consistently dipping in that critical payment module?
Answering these questions uncovers the kind of hidden issues a single test run will never show you.
- Failure Hotspots: If tests for a specific feature are always failing, that’s a massive red flag. It’s a sign the underlying code is probably brittle or way too complex. This data gives you all the justification you need to prioritize a refactoring effort.
- Performance Degradation: A slow, creeping increase in how long it takes to run your test suite can sneak up on you. By tracking this metric, you can see when performance is about to hit a breaking point and dedicate time to fixing slow tests before they cripple your CI feedback loop.
- Coverage Gaps: Monitoring coverage trends helps you make sure testing keeps up as new features are added. A downward trend in a crucial area—like authentication or billing—is a major risk you need to jump on immediately.
Treating test data as a first-class citizen is a cultural shift. It reframes test failures not as mistakes, but as valuable data points that guide the team toward building higher-quality, more resilient software.
From Data to Actionable Insights
So you've identified the patterns. What's next? You have to turn them into concrete actions.
The goal is to create a virtuous cycle where data from your tests directly informs your development priorities and even your architectural choices. This process turns your historical unit test results into a roadmap for what to do next.
Here’s a simple workflow for putting that test data to work:
- Identify Technical Debt: Use those failure hotspots to pinpoint the parts of your codebase drowning in technical debt. These are the perfect candidates for your next refactoring sprint.
- Guide Architectural Decisions: If you notice a certain architectural pattern consistently leads to code that’s a nightmare to test and prone to failure, you now have the evidence to argue for a different approach on future projects.
- Optimize Resource Allocation: Data can show you exactly where the team is burning the most time debugging. That insight helps you allocate resources better, whether it means more training, better documentation, or investing in smarter tooling.
When you build a culture where this data is regularly reviewed and discussed, you create a team that’s obsessed with continuous improvement. Failures become learning opportunities, and the insights they provide become the foundation for making smarter, data-driven decisions that improve both your code and your process.
Common Questions, Answered
Even when you've got the basics down, a few practical questions always pop up in day-to-day development. Let's tackle some of the most common ones.
What’s a Good Code Coverage Percentage?
There’s no magic number. In fact, blindly chasing 100% coverage often leads you down a rabbit hole of writing low-value tests just to make a metric look good.
Most teams find a sweet spot somewhere in the 70-90% range, which usually signals a healthy and well-tested codebase. The real key is to watch the trends. Use coverage reports like a map to find the dark, untested corners of your application, not as a final grade on your work. Always, always make sure your most complex and critical business logic is completely locked down with tests.
The goal isn't just a high percentage; it's confidence. Prevent coverage from dropping on new code and ensure your most critical paths are completely validated.
How Do I Test Code That Depends on External Services?
This is a classic one. True unit tests have to run in total isolation, which means they should never make a real network call or hit a live database. So what do you do? You fake it.
This is where "test doubles" like mocks and stubs come into play. You can program a mock to return a specific, predictable response—a successful JSON payload, a nasty error message, or even just empty data. This lets you test exactly how your code reacts to different scenarios, quickly and reliably, without any outside interference messing things up.
Why Are My Unit Tests So Slow?
Slow tests are a productivity killer. Simple as that. If the test suite takes forever to run, developers will just stop using it. Nine times out of ten, the culprit is an unintended I/O operation lurking somewhere—a sneaky network call or a file being written to disk.
First things first, double-check that every single external dependency is properly mocked. From there, take a look at your setup and teardown logic for any inefficiencies. And if your test runner supports it, try running tests in parallel. It can make a world of difference.
Ready to turn your test data into actionable insights? Mergify brings CI Insights directly into your pull requests, helping you spot failures, performance trends, and flaky tests automatically. Stop guessing and start making data-driven decisions. Learn more about how Mergify can help.